Estimated Value: $180,000 - $213,358
2
Beds
2
Baths
1,544
Sq Ft
$127/Sq Ft
Est. Value
About This Home
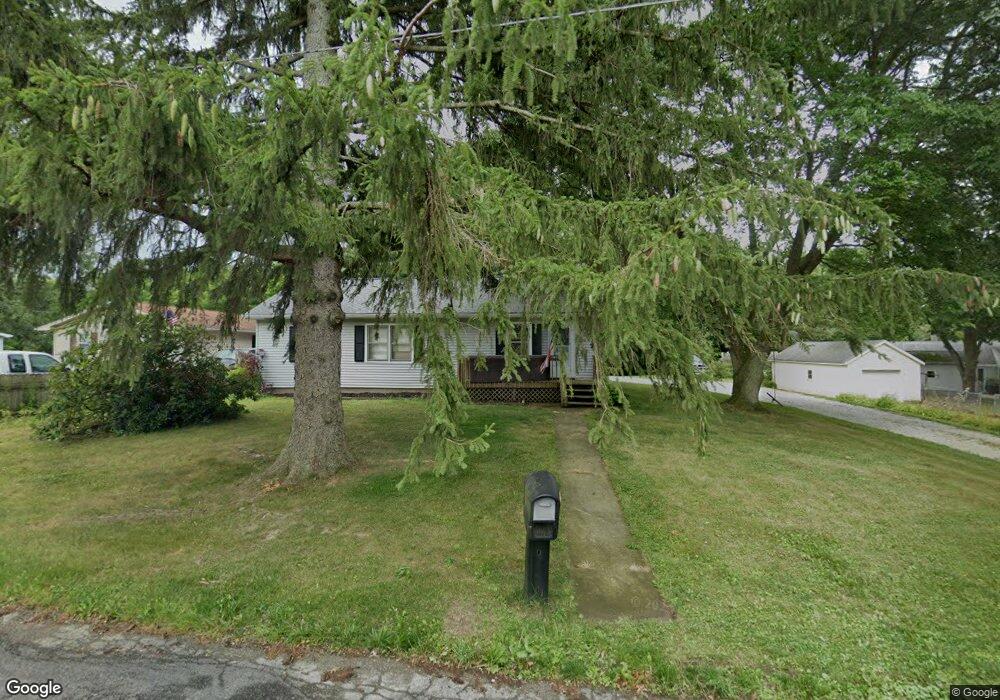
This home is located at 204 Gaylord Dr, Lodi, OH 44254 and is currently estimated at $196,590, approximately $127 per square foot. 204 Gaylord Dr is a home located in Medina County with nearby schools including Cloverleaf Elementary School, Cloverleaf Middle School, and Cloverleaf High School.
Ownership History
Date
Name
Owned For
Owner Type
Purchase Details
Closed on
Mar 4, 2013
Sold by
The Federal Home Loan Mortgage Corp
Bought by
Waddle Frank and Waddle Darlene
Current Estimated Value
Purchase Details
Closed on
Aug 20, 2012
Sold by
Shumway Michael A and Shumway Santina M
Bought by
Federal Home Loan Mortgage Corporation
Purchase Details
Closed on
Jul 25, 2006
Sold by
Shellhorn Deanna A
Bought by
Shumway Michael A
Purchase Details
Closed on
Dec 10, 2002
Sold by
Hale Nathan E
Bought by
Soya Robyn L and Shellhorn Deanna A
Home Financials for this Owner
Home Financials are based on the most recent Mortgage that was taken out on this home.
Original Mortgage
$92,000
Interest Rate
6.38%
Mortgage Type
New Conventional
Create a Home Valuation Report for This Property
The Home Valuation Report is an in-depth analysis detailing your home's value as well as a comparison with similar homes in the area
Home Values in the Area
Average Home Value in this Area
Purchase History
| Date | Buyer | Sale Price | Title Company |
|---|---|---|---|
| Waddle Frank | $53,700 | None Available | |
| Federal Home Loan Mortgage Corporation | $76,667 | None Available | |
| Shumway Michael A | $135,000 | -- | |
| Soya Robyn L | $117,000 | -- |
Source: Public Records
Mortgage History
| Date | Status | Borrower | Loan Amount |
|---|---|---|---|
| Previous Owner | Soya Robyn L | $92,000 |
Source: Public Records
Tax History Compared to Growth
Tax History
| Year | Tax Paid | Tax Assessment Tax Assessment Total Assessment is a certain percentage of the fair market value that is determined by local assessors to be the total taxable value of land and additions on the property. | Land | Improvement |
|---|---|---|---|---|
| 2024 | $2,131 | $48,360 | $18,170 | $30,190 |
| 2023 | $2,131 | $48,360 | $18,170 | $30,190 |
| 2022 | $2,350 | $48,360 | $18,170 | $30,190 |
| 2021 | $2,224 | $40,990 | $15,400 | $25,590 |
| 2020 | $2,256 | $40,990 | $15,400 | $25,590 |
| 2019 | $2,266 | $40,990 | $15,400 | $25,590 |
| 2018 | $2,200 | $37,520 | $13,160 | $24,360 |
| 2017 | $2,204 | $37,520 | $13,160 | $24,360 |
| 2016 | $2,233 | $37,520 | $13,160 | $24,360 |
| 2015 | $2,163 | $35,400 | $12,420 | $22,980 |
| 2014 | $1,979 | $35,400 | $12,420 | $22,980 |
| 2013 | $1,857 | $35,400 | $12,420 | $22,980 |
Source: Public Records
Map
Nearby Homes
- 221 N Market St
- 108 River St
- 125 Bank St
- 403 Young Dr
- 720 Medina St
- 133 S Broadway St
- 106 Anderson Cove Unit 206
- 8123 Vandemark Rd
- 0 Greenwich Rd Unit 5170888
- 7680 Vandemark Rd
- 7660 Vandemark Rd
- 7595 Kings Creek Dr
- 0 Cemetery Rd
- 9835 Congress Rd
- 7908 Garman Rd
- 7101 Greenwich Rd
- 131 Mill St
- 0 Shaw Rd Unit 5168184
- 7009 Greenwich Rd
- 0 Repp Rd
- 204 Gaylord St
- 206 Gaylord St
- 202 Gaylord St
- 208 Gaylord St
- 112 Gaylord St
- 203 Gaylord Dr
- 201 Legion St
- 205 Gaylord St
- 110 Gaylord St
- 212 Gaylord St
- 113 Gaylord Dr
- 113 Gaylord St
- 113 Gaylord St
- 115 Legion St
- 108 Gaylord St
- 211 Gaylord St
- 214 Gaylord St
- 410 Medina St
- 404 Medina St Unit 406
- 106 Gaylord St