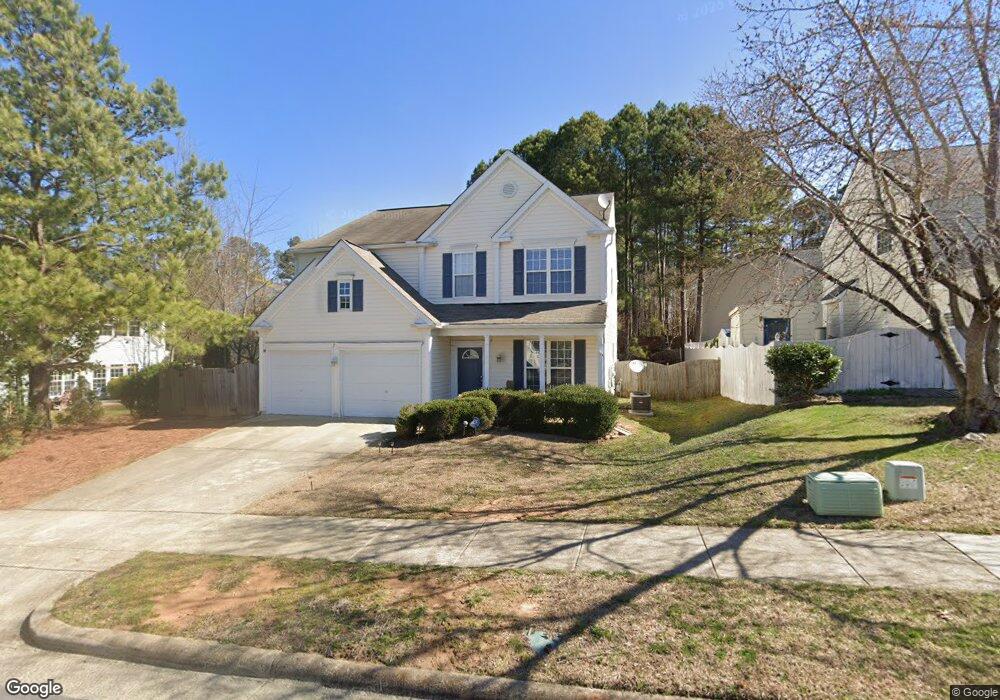
204 Grassy Point Rd Apex, NC 27502
West Apex NeighborhoodEstimated Value: $470,000 - $514,000
3
Beds
3
Baths
2,068
Sq Ft
$240/Sq Ft
Est. Value
About This Home
This home is located at 204 Grassy Point Rd, Apex, NC 27502 and is currently estimated at $495,740, approximately $239 per square foot. 204 Grassy Point Rd is a home located in Wake County with nearby schools including Olive Chapel Elementary School, Lufkin Road Middle School, and Apex Friendship High School.
Ownership History
Date
Name
Owned For
Owner Type
Purchase Details
Closed on
Dec 28, 2006
Sold by
Hill Thomas Michael and Hill Dreama Elaine
Bought by
Chang Sung Hsien and Yang Wei Lan
Current Estimated Value
Home Financials for this Owner
Home Financials are based on the most recent Mortgage that was taken out on this home.
Original Mortgage
$44,000
Outstanding Balance
$26,133
Interest Rate
6.1%
Mortgage Type
Credit Line Revolving
Estimated Equity
$469,607
Purchase Details
Closed on
Dec 2, 2003
Sold by
Osuagwu Jones C and Osuagwu Floria
Bought by
Mortgage Electronic Registration Systems
Purchase Details
Closed on
Mar 30, 2001
Sold by
Pulte Home Corp
Bought by
Osuagwu Jones C and Osuagwu Floria
Home Financials for this Owner
Home Financials are based on the most recent Mortgage that was taken out on this home.
Original Mortgage
$135,200
Interest Rate
6.6%
Create a Home Valuation Report for This Property
The Home Valuation Report is an in-depth analysis detailing your home's value as well as a comparison with similar homes in the area
Home Values in the Area
Average Home Value in this Area
Purchase History
| Date | Buyer | Sale Price | Title Company |
|---|---|---|---|
| Chang Sung Hsien | $220,000 | None Available | |
| Mortgage Electronic Registration Systems | $152,736 | -- | |
| Osuagwu Jones C | $169,000 | -- |
Source: Public Records
Mortgage History
| Date | Status | Borrower | Loan Amount |
|---|---|---|---|
| Open | Chang Sung Hsien | $44,000 | |
| Open | Chang Sung Hsien | $165,000 | |
| Previous Owner | Osuagwu Jones C | $135,200 | |
| Closed | Osuagwu Jones C | $33,800 |
Source: Public Records
Tax History
| Year | Tax Paid | Tax Assessment Tax Assessment Total Assessment is a certain percentage of the fair market value that is determined by local assessors to be the total taxable value of land and additions on the property. | Land | Improvement |
|---|---|---|---|---|
| 2025 | $4,291 | $489,178 | $180,000 | $309,178 |
| 2024 | $4,195 | $489,178 | $180,000 | $309,178 |
Source: Public Records
Map
Nearby Homes
- 2522 Olive Chapel Rd
- 2560 Olive Chapel Rd
- 2550 Olive Chapel Rd
- 2552 Olive Chapel Rd
- 3025 Equinox Ct
- 2562 Olive Chapel Rd
- 1512 Piazzo Ct
- 3008 Yorkmont Ct
- 3138 Cathedral Comb Dr
- 3120 Cathedral Comb Dr
- 3106 Cathedral Comb Dr
- 3104 Cathedral Comb Dr
- 3110 Honeydew Dr Unit Lot 198
- 3120 Cathedral Comb Dr Unit 247
- 3118 Cathedral Comb Dr
- 3116 Dadant Dr
- 3116 Dadant Dr Unit Lot 186
- 3116 Cathedral Comb Dr
- 3102 Cathedral Comb Dr
- 3110 Honeydew Dr
- 206 Grassy Point Rd
- 101 Walnut Hill Ct
- 100 Atkinson Ct
- 102 Atkinson Ct
- 105 Walnut Hill Ct
- 205 Grassy Point Rd
- 104 Atkinson Ct
- 207 Grassy Point Rd
- 107 Walnut Hill Ct
- 201 Grassy Point Rd
- 100 Walnut Hill Ct
- 301 Grassy Point Rd
- 106 Walnut Hill Ct
- 107 Grassy Point Rd
- 108 Grassy Point Rd
- 107 Atkinson Ct
- 104 Walnut Hill Ct
- 102 Walnut Hill Ct
- 207 Piney Woods Ln
- 303 Grassy Point Rd
Your Personal Tour Guide
Ask me questions while you tour the home.