Estimated Value: $414,000 - $466,000
5
Beds
3
Baths
2,890
Sq Ft
$151/Sq Ft
Est. Value
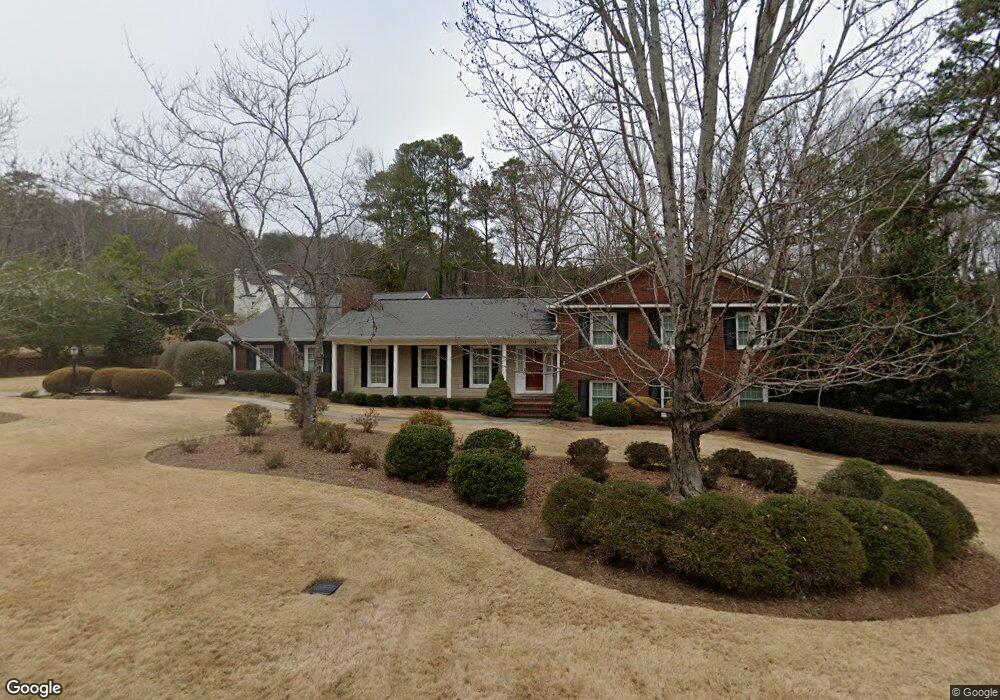
About This Home
This home is located at 204 Green View Rd SW, Rome, GA 30165 and is currently estimated at $435,615, approximately $150 per square foot. 204 Green View Rd SW is a home located in Floyd County with nearby schools including Rome High School and Darlington School.
Ownership History
Date
Name
Owned For
Owner Type
Purchase Details
Closed on
Jul 30, 2014
Sold by
Shelton David J and Shel Cindy L
Bought by
Shelton David J and Shelton Cindy L
Current Estimated Value
Purchase Details
Closed on
Dec 18, 2013
Sold by
Shelton David J
Bought by
Shelton David J and Shelton Cindy L
Purchase Details
Closed on
Oct 13, 2009
Sold by
Murph Joni S and Murph Jesse E
Bought by
Shelton David J and Shelton Cindy L
Home Financials for this Owner
Home Financials are based on the most recent Mortgage that was taken out on this home.
Original Mortgage
$100,000
Interest Rate
4.48%
Mortgage Type
New Conventional
Purchase Details
Closed on
May 10, 2002
Sold by
Gavel Neil Albert and Gavel Connie M
Bought by
Murph Joni S and Murph Jesse E
Purchase Details
Closed on
Nov 13, 1995
Sold by
Byars Hardin C
Bought by
Gavel Neil Albert and Gavel Connie M
Purchase Details
Closed on
Jan 1, 1960
Sold by
Covington Jim & Co
Bought by
Byars Hardin C
Purchase Details
Closed on
Jan 1, 1901
Bought by
Covington Jim & Co
Create a Home Valuation Report for This Property
The Home Valuation Report is an in-depth analysis detailing your home's value as well as a comparison with similar homes in the area
Home Values in the Area
Average Home Value in this Area
Purchase History
| Date | Buyer | Sale Price | Title Company |
|---|---|---|---|
| Shelton David J | -- | -- | |
| Shelton David J | -- | -- | |
| Shelton David J | $217,400 | -- | |
| Murph Joni S | $200,000 | -- | |
| Gavel Neil Albert | $160,000 | -- | |
| Byars Hardin C | -- | -- | |
| Covington Jim & Co | -- | -- |
Source: Public Records
Mortgage History
| Date | Status | Borrower | Loan Amount |
|---|---|---|---|
| Previous Owner | Shelton David J | $100,000 |
Source: Public Records
Tax History Compared to Growth
Tax History
| Year | Tax Paid | Tax Assessment Tax Assessment Total Assessment is a certain percentage of the fair market value that is determined by local assessors to be the total taxable value of land and additions on the property. | Land | Improvement |
|---|---|---|---|---|
| 2024 | $4,232 | $176,421 | $21,425 | $154,996 |
| 2023 | $3,318 | $140,638 | $19,351 | $121,287 |
| 2022 | $3,103 | $120,677 | $15,896 | $104,781 |
| 2021 | $2,937 | $110,664 | $15,896 | $94,768 |
| 2020 | $2,844 | $103,679 | $12,095 | $91,584 |
| 2019 | $2,766 | $100,661 | $12,095 | $88,566 |
| 2018 | $2,707 | $97,118 | $12,095 | $85,023 |
| 2017 | $2,660 | $94,252 | $12,095 | $82,157 |
| 2016 | $2,661 | $93,609 | $12,080 | $81,529 |
| 2015 | $2,405 | $90,081 | $12,080 | $78,001 |
| 2014 | $2,405 | $90,081 | $12,080 | $78,001 |
Source: Public Records
Map
Nearby Homes
- 0 Featherston Rd SW Unit 13890394
- 0 Featherston Rd SW Unit 10512723
- 17 Crestwood Dr SW
- 8 Crestwood Dr SW
- 7 Pine Valley Rd SW
- 20 Pine Valley Rd SW
- 11 Brow Rd SW
- 0 Hidden Ridge Dr Unit 10343694
- 0 Hidden Ridge Dr Unit 10343706
- 0 Hidden Ridge Dr Unit 10343701
- 0 Hidden Ridge Dr Unit 10343693
- 0 Hidden Ridge Dr Unit 10343685
- 0 Hidden Ridge Dr Unit 10556470
- 0 Hidden Ridge Dr Unit 10343688
- 0 Hidden Ridge Dr Unit 10343680
- 0 Hidden Ridge Dr Unit 10343696
- 0 Hidden Ridge Dr Unit 10343689
- 0 Hidden Ridge Dr Unit 10343700
- 0 Hidden Ridge Dr Unit 10343676
- 5 Saint Andrews Way SW
- 206 Green View Rd SW
- 210 Green View Rd SW
- 208 Green View Rd SW
- 205 Green View Rd SW
- 212 Green View Rd SW
- 203 Green View Rd SW
- 207 Green View Rd SW
- 200 Green View Rd SW
- 214 Green View Rd SW
- 201 Green View Rd SW
- 219 Green View Rd SW
- 209 Green View Rd SW
- 211 Green View Rd SW
- 211 Green View Rd SW
- 221 Green View Rd SW
- 4 Bridlewood Ln SW
- 215 Green View Rd SW
- 223 Green View Rd SW
- 7 Bridlewood Ln SW
- 39 Pine Valley Rd SW