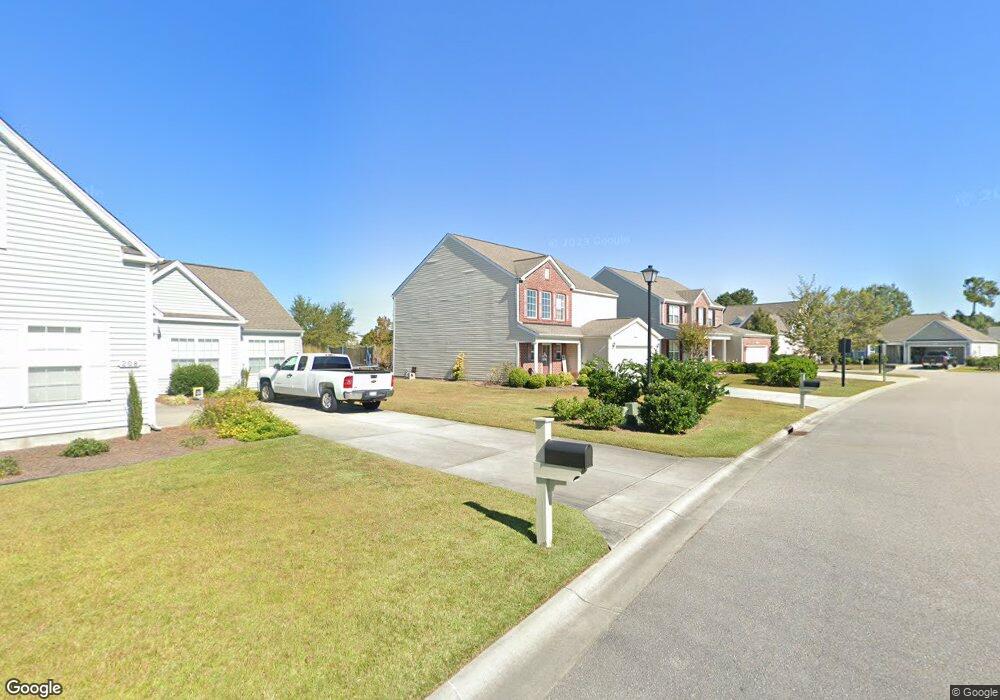
204 Gresham Ln Myrtle Beach, SC 29588
Estimated Value: $320,000 - $349,000
3
Beds
3
Baths
1,893
Sq Ft
$177/Sq Ft
Est. Value
About This Home
This home is located at 204 Gresham Ln, Myrtle Beach, SC 29588 and is currently estimated at $334,934, approximately $176 per square foot. 204 Gresham Ln is a home located in Horry County with nearby schools including Lakewood Elementary, Socastee Middle, and Socastee High School.
Ownership History
Date
Name
Owned For
Owner Type
Purchase Details
Closed on
Feb 10, 2015
Sold by
Mckenzie Brian J and Mckenzie Kaitlin L
Bought by
Lorusso Michelle A L and Lorusso Nicholas A
Current Estimated Value
Home Financials for this Owner
Home Financials are based on the most recent Mortgage that was taken out on this home.
Original Mortgage
$160,500
Outstanding Balance
$121,442
Interest Rate
3.75%
Mortgage Type
Future Advance Clause Open End Mortgage
Estimated Equity
$213,492
Purchase Details
Closed on
Sep 25, 2012
Sold by
Federal National Mortgage Association
Bought by
Mckenzie Brian J
Purchase Details
Closed on
Jun 28, 2012
Sold by
Master In Equity Horry County
Bought by
Federal National Mortgage Association
Purchase Details
Closed on
Nov 30, 2006
Sold by
D R Horton Inc
Bought by
Foran Gerald J
Home Financials for this Owner
Home Financials are based on the most recent Mortgage that was taken out on this home.
Original Mortgage
$203,310
Interest Rate
6.29%
Mortgage Type
Purchase Money Mortgage
Create a Home Valuation Report for This Property
The Home Valuation Report is an in-depth analysis detailing your home's value as well as a comparison with similar homes in the area
Home Values in the Area
Average Home Value in this Area
Purchase History
| Date | Buyer | Sale Price | Title Company |
|---|---|---|---|
| Lorusso Michelle A L | $172,000 | -- | |
| Mckenzie Brian J | -- | -- | |
| Federal National Mortgage Association | $230,693 | -- | |
| Foran Gerald J | $225,900 | None Available |
Source: Public Records
Mortgage History
| Date | Status | Borrower | Loan Amount |
|---|---|---|---|
| Open | Lorusso Michelle A L | $160,500 | |
| Previous Owner | Foran Gerald J | $203,310 |
Source: Public Records
Tax History
| Year | Tax Paid | Tax Assessment Tax Assessment Total Assessment is a certain percentage of the fair market value that is determined by local assessors to be the total taxable value of land and additions on the property. | Land | Improvement |
|---|---|---|---|---|
| 2025 | -- | $0 | $0 | $0 |
| 2024 | -- | $13,017 | $3,146 | $9,871 |
| 2023 | $916 | $7,816 | $1,591 | $6,225 |
| 2021 | $829 | $8,207 | $1,591 | $6,616 |
| 2020 | $725 | $8,207 | $1,591 | $6,616 |
| 2019 | $725 | $8,207 | $1,591 | $6,616 |
| 2018 | $654 | $6,796 | $1,412 | $5,384 |
| 2017 | $0 | $6,796 | $1,412 | $5,384 |
| 2016 | -- | $6,796 | $1,412 | $5,384 |
| 2015 | $614 | $6,396 | $1,412 | $4,984 |
| 2014 | $568 | $6,396 | $1,412 | $4,984 |
Source: Public Records
Map
Nearby Homes
- 630 Glen Haven Dr
- 339 Burchwood Ln
- 238 Burchwood Ln
- 453 Mooreland Dr
- 452 Palm Frond Dr
- 812 Hayes Point Cir
- 519 Heritage Point Dr
- 71 Plantation Rd
- 3811 Maypop Cir Unit 17-C
- 653 Kindred Dr
- Parcel "A" Palmetto Pointe Blvd
- 29 Cheyenne Rd Unit MB
- 424 Wallingford Cir
- 540 Calypso Dr
- 523 Slaty Dr
- 507 Slaty Dr
- 2 Sioux Trail
- 113 Olde Towne Way Unit 3
- 121 Olde Towne Way Unit 2
- 33 Plantation Rd
- 204 Gresham Ln
- 200 Gresham Ln
- 208 Gresham Ln
- 212 Gresham Ln Unit Woodbury
- 212 Gresham Ln
- 112 Powder Springs Loop
- 112 Powder Springs Loop Unit Lot- 59
- 301 Brookmont Dr
- 116 Powder Springs Loop
- 116 Powder Springs Loop Unit lot 60
- 101 Powder Springs Loop
- 101 Powder Springs Loop Unit Lot 17
- 105 Powder Springs Loop
- 216 Gresham Ln
- 305 Brookmont Dr
- 109 Powder Springs Loop
- 113 Powder Springs Loop
- 120 Powder Springs Loop
- 120 Powder Springs Loop Unit Lot 61
- 220 Gresham Ln
Your Personal Tour Guide
Ask me questions while you tour the home.