Estimated Value: $394,541 - $435,000
4
Beds
3
Baths
2,385
Sq Ft
$174/Sq Ft
Est. Value
About This Home
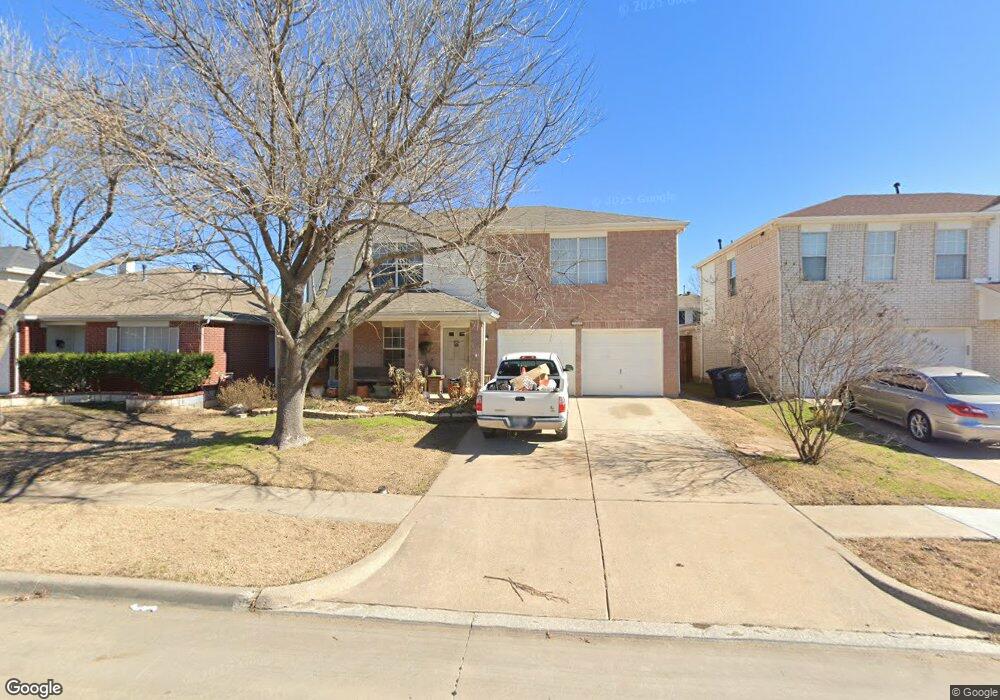
This home is located at 204 Lakefront Dr, Wylie, TX 75098 and is currently estimated at $414,135, approximately $173 per square foot. 204 Lakefront Dr is a home located in Collin County with nearby schools including R V Groves Elementary School, Dr. Al Draper Intermediate Middle School, and Raymond B Cooper J High School.
Ownership History
Date
Name
Owned For
Owner Type
Purchase Details
Closed on
Dec 30, 2004
Sold by
Hud
Bought by
Link Toby
Current Estimated Value
Home Financials for this Owner
Home Financials are based on the most recent Mortgage that was taken out on this home.
Original Mortgage
$102,800
Outstanding Balance
$58,907
Interest Rate
7.85%
Mortgage Type
Purchase Money Mortgage
Estimated Equity
$355,228
Purchase Details
Closed on
Sep 13, 2004
Sold by
Mortgage Electronic Registration Systems
Bought by
Hud
Purchase Details
Closed on
Sep 7, 2004
Sold by
Allen Damion and Allen Catherine
Bought by
Mortgage Electronic Registration Systems
Purchase Details
Closed on
Feb 28, 2002
Sold by
Pulte Homes Of Texas Lp
Bought by
Allen Damion and Coulter Catherine
Home Financials for this Owner
Home Financials are based on the most recent Mortgage that was taken out on this home.
Original Mortgage
$160,235
Interest Rate
6.81%
Mortgage Type
FHA
Create a Home Valuation Report for This Property
The Home Valuation Report is an in-depth analysis detailing your home's value as well as a comparison with similar homes in the area
Home Values in the Area
Average Home Value in this Area
Purchase History
| Date | Buyer | Sale Price | Title Company |
|---|---|---|---|
| Link Toby | -- | -- | |
| Hud | -- | -- | |
| Mortgage Electronic Registration Systems | $169,528 | -- | |
| Allen Damion | -- | -- |
Source: Public Records
Mortgage History
| Date | Status | Borrower | Loan Amount |
|---|---|---|---|
| Open | Link Toby | $102,800 | |
| Previous Owner | Allen Damion | $160,235 | |
| Closed | Link Toby | $25,700 |
Source: Public Records
Tax History Compared to Growth
Tax History
| Year | Tax Paid | Tax Assessment Tax Assessment Total Assessment is a certain percentage of the fair market value that is determined by local assessors to be the total taxable value of land and additions on the property. | Land | Improvement |
|---|---|---|---|---|
| 2025 | $5,650 | $387,067 | $95,000 | $342,599 |
| 2024 | $5,650 | $351,879 | $95,000 | $285,000 |
| 2023 | $5,650 | $319,890 | $95,000 | $276,275 |
| 2022 | $6,380 | $290,809 | $75,000 | $269,765 |
| 2021 | $6,220 | $267,202 | $55,000 | $212,202 |
| 2020 | $5,968 | $240,338 | $55,000 | $185,338 |
| 2019 | $6,386 | $243,000 | $55,000 | $188,000 |
| 2018 | $6,236 | $231,559 | $55,000 | $186,000 |
| 2017 | $5,669 | $228,556 | $50,000 | $178,556 |
| 2016 | $5,317 | $194,996 | $40,000 | $154,996 |
| 2015 | $4,220 | $181,669 | $35,000 | $146,669 |
Source: Public Records
Map
Nearby Homes
- 208 Lakefront Dr
- 207 Creekview Dr
- 301 Creekview Dr
- 206 Grassy Creek Dr
- 2606 Parkbridge Ct
- 2722 W Fm 544
- 2710 W Fm 544
- 2615 Gum Tree Trail
- Iris Plan at Wooded Creek
- Beckett II Plan at Wooded Creek
- Annabelle III Plan at Wooded Creek
- 2114 Parkhurst Ct
- 3003 Candlebrook Dr
- 3006 Springwell Pkwy
- 3017 Eagle Mountain Dr
- 3103 Creekwood Dr
- 307 Wooded Creek Ave
- 310 Admiral Dr
- 3111 Candlebrook Dr
- 3105 Admiral Dr
- 206 Lakefront Dr
- 202 Lakefront Dr
- 200 Lakefront Dr
- 205 Waterwood Dr
- 207 Waterwood Dr
- 203 Waterwood Dr
- 110 Lakefront Dr
- 210 Lakefront Dr
- 209 Waterwood Dr
- 209 Waterwood Dr
- 201 Waterwood Dr
- 205 Lakefront Dr
- 203 Lakefront Dr
- 207 Lakefront Dr
- 211 Waterwood Dr
- 111 Waterwood Dr
- 201 Lakefront Dr
- 300 Lakefront Dr
- 108 Lakefront Dr
- 209 Lakefront Dr