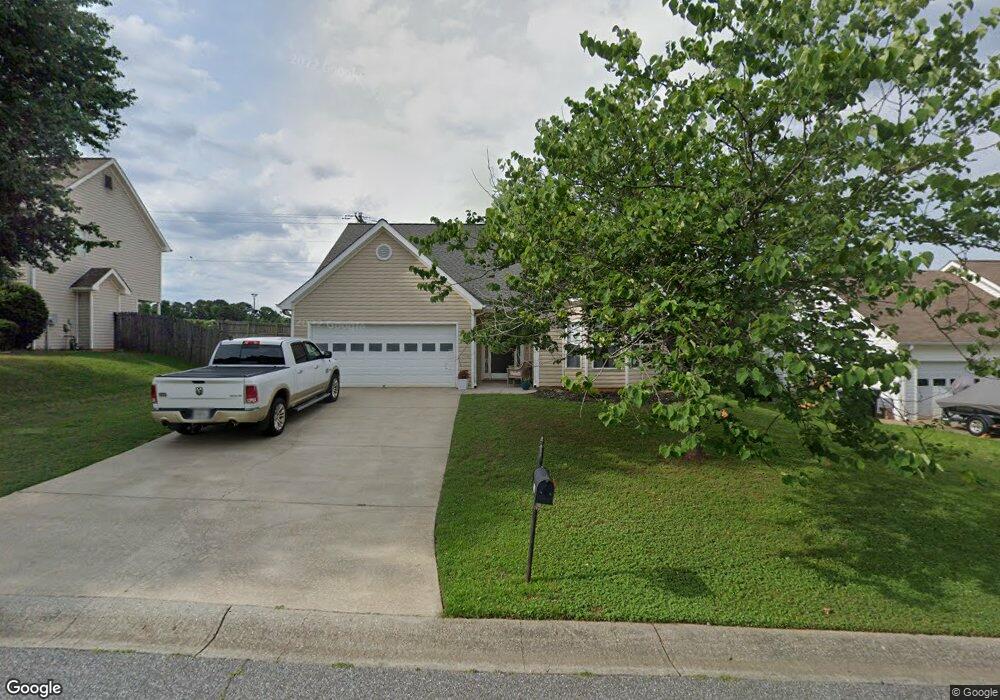
204 Lee Ct Canton, GA 30115
Estimated Value: $351,000
About This Home
Please note, our homes are available on a first-come, first-serve basis and are not reserved until the lease is signed by all applicants and security deposits are collected.
This home features Progress Smart Home - Progress Residential's smart home app, which allows you to control the home securely from any of your devices. Learn more at
Want to tour on your own? Click the “Self Tour” button on this home’s listing or call to register for a self-guided showing at a time that works best for you.
Some images have been virtually staged to help showcase the potential of spaces in the home. The furnishings shown are for illustrative purposes only and are not included in the home.Interested in this home? You clearly have exceptional taste. Like all our homes, this one features: a great location in a desirable neighborhood, a comfortable layout with good-sized bedrooms and bathrooms, a great kitchen with plenty of counter and cabinet space, many updated and upgraded features, central HVAC and programmable thermostat, garage and a spacious yard, and it's pet friendly. Call or click to schedule a tour or submit your application online at today!
At Progress Residential® we're here to serve you and make your time in the home as convenient as possible. We offer: a safe and secure online portal where you can place maintenance requests and pay online, multiple payment options, 24/7 Emergency maintenance response team available even on weekends, and well-maintained homes with regular preventative maintenance.
Ownership History
Purchase Details
Purchase Details
Purchase Details
Purchase Details
Home Financials for this Owner
Home Financials are based on the most recent Mortgage that was taken out on this home.Purchase Details
Home Financials for this Owner
Home Financials are based on the most recent Mortgage that was taken out on this home.Home Values in the Area
Average Home Value in this Area
Purchase History
| Date | Buyer | Sale Price | Title Company |
|---|---|---|---|
| Progress Residential Borrower 23 Llc | -- | -- | |
| Sfr V Tranche 3 Borrower Llc | $1,914,054 | -- | |
| Zillow Homes Property Trust | $303,800 | -- | |
| Cox L C | $155,000 | -- | |
| Lummus Ted L | $141,900 | -- |
Mortgage History
| Date | Status | Borrower | Loan Amount |
|---|---|---|---|
| Previous Owner | Cox L C | $147,250 | |
| Previous Owner | Lummus Ted L | $113,520 |
Property History
| Date | Event | Price | List to Sale | Price per Sq Ft |
|---|---|---|---|---|
| 09/22/2025 09/22/25 | Off Market | $2,120 | -- | -- |
| 09/14/2025 09/14/25 | Price Changed | $2,120 | -1.2% | $2 / Sq Ft |
| 09/10/2025 09/10/25 | Price Changed | $2,145 | -2.9% | $2 / Sq Ft |
| 09/05/2025 09/05/25 | Price Changed | $2,210 | +6.3% | $2 / Sq Ft |
| 08/30/2025 08/30/25 | Price Changed | $2,080 | -0.7% | $1 / Sq Ft |
| 08/29/2025 08/29/25 | Price Changed | $2,095 | -0.5% | $1 / Sq Ft |
| 08/09/2025 08/09/25 | Price Changed | $2,105 | -0.7% | $1 / Sq Ft |
| 08/08/2025 08/08/25 | Price Changed | $2,120 | -1.2% | $2 / Sq Ft |
| 07/22/2025 07/22/25 | Price Changed | $2,145 | -0.9% | $2 / Sq Ft |
| 07/21/2025 07/21/25 | Price Changed | $2,165 | -0.2% | $2 / Sq Ft |
| 07/13/2025 07/13/25 | For Rent | $2,170 | -- | -- |
Tax History
| Year | Tax Paid | Tax Assessment Tax Assessment Total Assessment is a certain percentage of the fair market value that is determined by local assessors to be the total taxable value of land and additions on the property. | Land | Improvement |
|---|---|---|---|---|
| 2025 | $6,832 | $135,344 | $28,000 | $107,344 |
| 2024 | $4,075 | $136,608 | $28,000 | $108,608 |
| 2023 | $3,980 | $131,424 | $26,800 | $104,624 |
| 2022 | $3,388 | $110,888 | $22,000 | $88,888 |
| 2021 | $2,128 | $84,800 | $20,000 | $64,800 |
| 2020 | $1,790 | $71,240 | $14,800 | $56,440 |
| 2019 | $1,796 | $71,440 | $14,800 | $56,640 |
| 2018 | $1,601 | $63,240 | $13,200 | $50,040 |
| 2017 | $1,451 | $153,100 | $13,200 | $48,040 |
| 2016 | $1,451 | $140,900 | $12,000 | $44,360 |
| 2015 | $1,382 | $133,100 | $10,000 | $43,240 |
| 2014 | $1,245 | $119,600 | $10,000 | $37,840 |
Map
- 802 Hampton Way
- 704 Jay St
- 132 Carl Barrett Dr
- 108 Riley Way
- 557 Hickory Rd
- 221 Mackenzie Ct
- 332 Pine Acres Dr Unit 12
- 108 Madison St
- 101 Alaina Rd
- 117 Alaina Rd
- 149 Alaina Rd
- 1100 Spring Place
- 145 Alaina Rd
- 312 Hannah Place
- 111 Sequoyah Cir
- 172 Madison St
- 153 Spring Creek Ct Unit 1
- 437 Twin Lakes Dr
- 1980 Morgan Trace
- 354 Ridgewood Trail
- 202 Lee Ct
- 202 Lee Ct
- 202 Lee Ct
- 206 Lee Ct
- 0 Hickory Rd Unit 3143685
- 0 Hickory Rd Unit 7161665
- 0 Hickory Rd Unit 7267389
- 0 Hickory Rd Unit 4035447
- 0 Hickory Rd Unit 4289203
- 0 Hickory Rd Unit 5201961
- 0 Hickory Rd Unit 5288239
- 200 Lee Ct
- 208 Lee Ct
- 205 Lee Ct
- 207 Lee Ct
- 203 Lee Ct
- 209 Lee Ct
- 201 Lee Ct
- 210 Lee Ct
- 500 Charles Dr
Ask me questions while you tour the home.