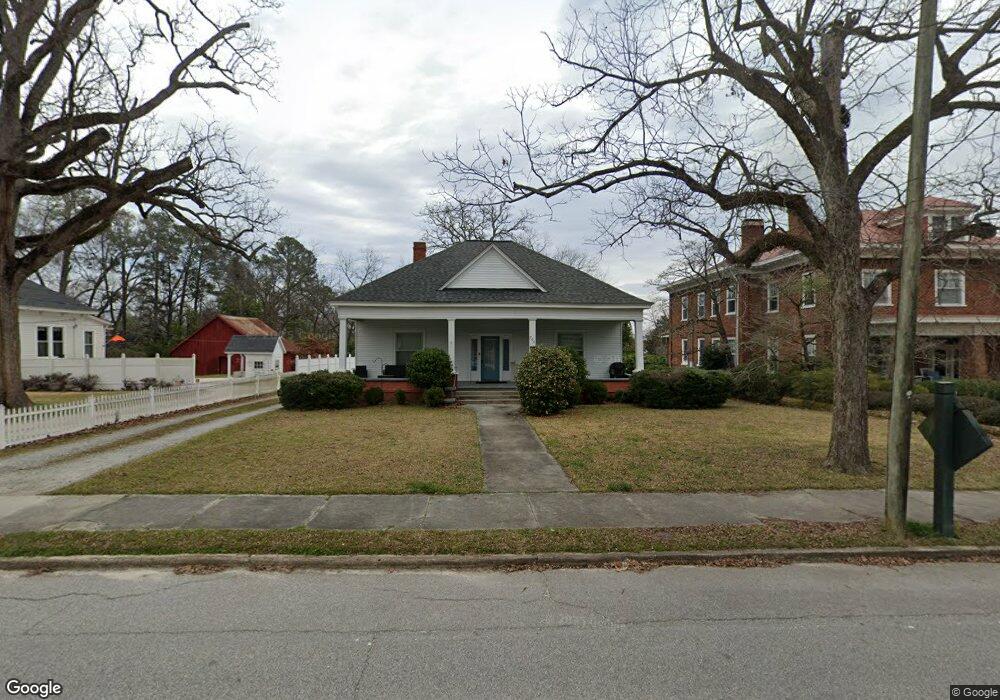
204 Lee St Thomson, GA 30824
Estimated Value: $147,998 - $288,000
3
Beds
1
Bath
1,632
Sq Ft
$126/Sq Ft
Est. Value
About This Home
This home is located at 204 Lee St, Thomson, GA 30824 and is currently estimated at $206,250, approximately $126 per square foot. 204 Lee St is a home located in McDuffie County with nearby schools including Thomson High School.
Ownership History
Date
Name
Owned For
Owner Type
Purchase Details
Closed on
Oct 24, 2008
Sold by
Perryman John
Bought by
Lunceford Clifford G
Current Estimated Value
Purchase Details
Closed on
Sep 3, 2004
Sold by
Perryman Dorothy C
Bought by
Perryman John C
Purchase Details
Closed on
Aug 9, 2004
Sold by
Perryman Dorothy C
Bought by
Perryman Dorothy C
Purchase Details
Closed on
Jul 28, 2004
Sold by
Perryman Dorothy C
Bought by
Perryman Dorothy C
Purchase Details
Closed on
Aug 28, 2003
Sold by
Usry Edith C
Bought by
Perryman Dorothy C
Purchase Details
Closed on
Feb 28, 1973
Bought by
Usry Edith C
Create a Home Valuation Report for This Property
The Home Valuation Report is an in-depth analysis detailing your home's value as well as a comparison with similar homes in the area
Home Values in the Area
Average Home Value in this Area
Purchase History
| Date | Buyer | Sale Price | Title Company |
|---|---|---|---|
| Lunceford Clifford G | $80,000 | -- | |
| Perryman John C | $22,000 | -- | |
| Perryman Dorothy C | $12,500 | -- | |
| Perryman Dorothy C | $12,500 | -- | |
| Perryman Dorothy C | -- | -- | |
| Usry Edith C | -- | -- |
Source: Public Records
Tax History
| Year | Tax Paid | Tax Assessment Tax Assessment Total Assessment is a certain percentage of the fair market value that is determined by local assessors to be the total taxable value of land and additions on the property. | Land | Improvement |
|---|---|---|---|---|
| 2025 | $2,067 | $66,386 | $2,464 | $63,922 |
| 2024 | $2,067 | $63,140 | $2,352 | $60,788 |
| 2023 | $1,991 | $60,634 | $2,240 | $58,394 |
| 2022 | $1,639 | $47,950 | $1,792 | $46,158 |
| 2021 | $1,322 | $38,048 | $2,240 | $35,808 |
| 2020 | $953 | $27,168 | $7,459 | $19,709 |
| 2019 | $976 | $27,574 | $7,459 | $20,115 |
| 2018 | $986 | $27,574 | $7,459 | $20,115 |
| 2017 | $959 | $27,574 | $7,459 | $20,115 |
| 2016 | $965 | $27,574 | $7,459 | $20,115 |
| 2015 | $856 | $27,574 | $7,459 | $20,115 |
| 2014 | $859 | $27,574 | $7,459 | $20,115 |
| 2013 | -- | $27,574 | $7,459 | $20,115 |
Source: Public Records
Map
Nearby Homes
Your Personal Tour Guide
Ask me questions while you tour the home.