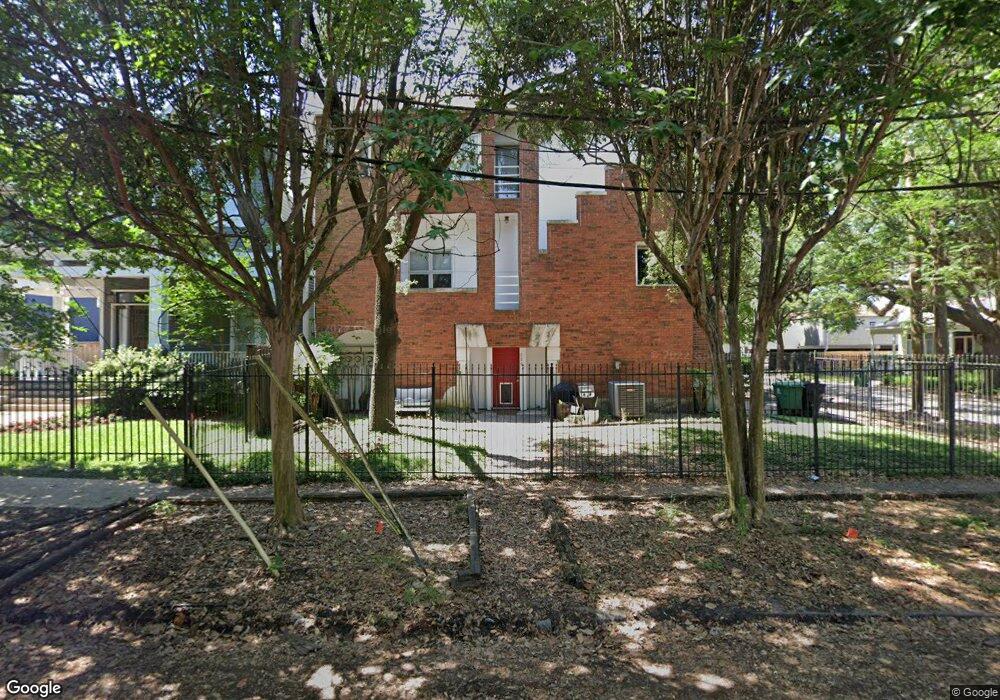
204 Marshall St Unit 3 Houston, TX 77006
Montrose NeighborhoodEstimated Value: $385,416 - $519,000
2
Beds
3
Baths
1,756
Sq Ft
$247/Sq Ft
Est. Value
About This Home
This home is located at 204 Marshall St Unit 3, Houston, TX 77006 and is currently estimated at $434,354, approximately $247 per square foot. 204 Marshall St Unit 3 is a home located in Harris County with nearby schools including MacGregor Elementary School, Gregory-Lincoln Ed Center, and Lamar High School.
Ownership History
Date
Name
Owned For
Owner Type
Purchase Details
Closed on
Dec 30, 2019
Sold by
Seville Rian
Bought by
Mak David H and Mak Tyra
Current Estimated Value
Home Financials for this Owner
Home Financials are based on the most recent Mortgage that was taken out on this home.
Original Mortgage
$222,000
Outstanding Balance
$196,146
Interest Rate
3.6%
Mortgage Type
New Conventional
Estimated Equity
$238,208
Purchase Details
Closed on
Jan 2, 2013
Sold by
Pendola Gianmarco and Rumbea Denise
Bought by
Seville Rian
Home Financials for this Owner
Home Financials are based on the most recent Mortgage that was taken out on this home.
Original Mortgage
$237,000
Interest Rate
3.42%
Mortgage Type
VA
Purchase Details
Closed on
Feb 3, 2012
Sold by
Lippert Matthew Paul
Bought by
Pendola Gianmarco and Rumbea Denise
Create a Home Valuation Report for This Property
The Home Valuation Report is an in-depth analysis detailing your home's value as well as a comparison with similar homes in the area
Home Values in the Area
Average Home Value in this Area
Purchase History
| Date | Buyer | Sale Price | Title Company |
|---|---|---|---|
| Mak David H | -- | Chicago Title | |
| Seville Rian | -- | None Available | |
| Pendola Gianmarco | -- | Chicago Title |
Source: Public Records
Mortgage History
| Date | Status | Borrower | Loan Amount |
|---|---|---|---|
| Open | Mak David H | $222,000 | |
| Previous Owner | Seville Rian | $237,000 |
Source: Public Records
Tax History Compared to Growth
Tax History
| Year | Tax Paid | Tax Assessment Tax Assessment Total Assessment is a certain percentage of the fair market value that is determined by local assessors to be the total taxable value of land and additions on the property. | Land | Improvement |
|---|---|---|---|---|
| 2025 | $7,403 | $374,699 | $139,065 | $235,634 |
| 2024 | $7,403 | $353,819 | $139,065 | $214,754 |
| 2023 | $7,403 | $387,856 | $139,065 | $248,791 |
| 2022 | $7,950 | $361,050 | $125,159 | $235,891 |
| 2021 | $7,852 | $336,914 | $111,252 | $225,662 |
| 2020 | $7,507 | $310,000 | $111,252 | $198,748 |
| 2019 | $7,844 | $310,000 | $111,252 | $198,748 |
| 2018 | $6,245 | $328,000 | $111,252 | $216,748 |
| 2017 | $22,702 | $427,773 | $111,252 | $316,521 |
| 2016 | $11,017 | $415,183 | $111,252 | $303,931 |
| 2015 | $8,466 | $401,277 | $97,346 | $303,931 |
| 2014 | $8,466 | $334,340 | $83,439 | $250,901 |
Source: Public Records
Map
Nearby Homes
- 222 Marshall St
- 324 W Alabama St
- 3613 Audubon Place
- 3603 Audubon Place
- 221 Emerson St
- 606 Marshall St Unit 35
- 606 Marshall St Unit 36
- 606 Marshall St Unit 2
- 606 Marshall St Unit 27
- 3818 Brandt St
- 429 Hawthorne St
- 432 Marshall St
- 3416 Audubon Place
- 3402 Garrott St Unit 13
- 3402 Garrott St Unit 15
- 3502 Burlington St Unit 1
- 502 Hawthorne St
- 612 Harold St
- 624 Harold St
- 708 Sul Ross St
- 204 Marshall St Unit 5
- 204 Marshall St Unit 4
- 204 Marshall St Unit 1
- 204 Marshall St Unit 2
- 204 Marshall St
- 212 Marshall St
- 208 Marshall St
- 204 Marshall Unit 3 St
- 200 Marshall St
- 206 Marshall St
- 246 Marshall St
- 210 Marshall St Unit 4
- 210 Marshall St
- 210 Marshall St Unit 5
- 210 (1/2) Marshall St Unit 3
- 210 Marshall 1 2 St Unit 1
- 210 Marshall St Unit A
- 210 Marshall St Unit 2
- 210 Marshall St Unit 1
- 213 Marshall St