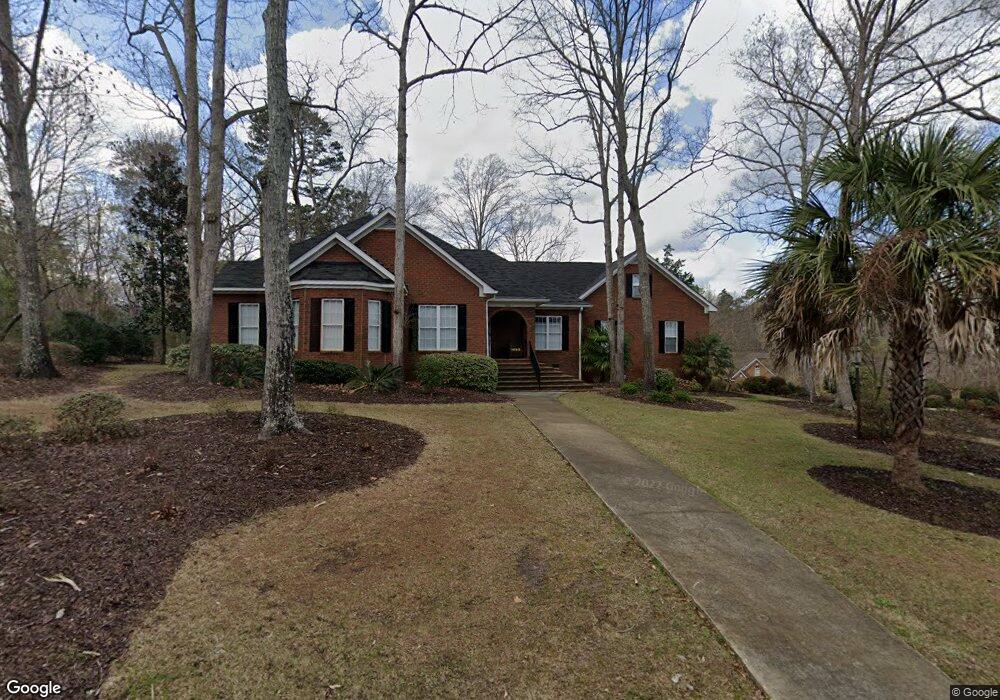
204 Misty Oaks Ct Lexington, SC 29072
Estimated Value: $575,000 - $621,286
4
Beds
4
Baths
3,133
Sq Ft
$189/Sq Ft
Est. Value
About This Home
This home is located at 204 Misty Oaks Ct, Lexington, SC 29072 and is currently estimated at $593,322, approximately $189 per square foot. 204 Misty Oaks Ct is a home located in Lexington County with nearby schools including Midway Elementary School, River Bluff High School, and Lake Murray Montessori School.
Ownership History
Date
Name
Owned For
Owner Type
Purchase Details
Closed on
Mar 8, 2024
Sold by
Wilfong Harriett M
Bought by
Walker Scott Allen and Walker Carole Veronica
Current Estimated Value
Purchase Details
Closed on
Feb 27, 2024
Sold by
Pippin Deborah R and Wilfong Jeffrey M
Bought by
Wilfong Harriett M
Purchase Details
Closed on
Jan 31, 2019
Sold by
Campbell Timothy P
Bought by
Wilfong Harriett M and Pippin Deborah R
Purchase Details
Closed on
Sep 11, 2013
Sold by
Grubbs Elberta Acton
Bought by
Campbell Timothy P
Home Financials for this Owner
Home Financials are based on the most recent Mortgage that was taken out on this home.
Original Mortgage
$235,653
Interest Rate
4.25%
Mortgage Type
FHA
Purchase Details
Closed on
Jun 16, 2005
Sold by
Powers Cecil L and Powers Martha G
Bought by
Grubbs Elberta Acton
Create a Home Valuation Report for This Property
The Home Valuation Report is an in-depth analysis detailing your home's value as well as a comparison with similar homes in the area
Home Values in the Area
Average Home Value in this Area
Purchase History
| Date | Buyer | Sale Price | Title Company |
|---|---|---|---|
| Walker Scott Allen | $570,000 | None Listed On Document | |
| Wilfong Harriett M | -- | None Listed On Document | |
| Wilfong Harriett M | $418,500 | None Available | |
| Campbell Timothy P | $240,000 | -- | |
| Grubbs Elberta Acton | $338,800 | -- | |
| Grubbs Elberta Acton | -- | -- |
Source: Public Records
Mortgage History
| Date | Status | Borrower | Loan Amount |
|---|---|---|---|
| Previous Owner | Campbell Timothy P | $235,653 |
Source: Public Records
Tax History Compared to Growth
Tax History
| Year | Tax Paid | Tax Assessment Tax Assessment Total Assessment is a certain percentage of the fair market value that is determined by local assessors to be the total taxable value of land and additions on the property. | Land | Improvement |
|---|---|---|---|---|
| 2024 | $2,077 | $16,740 | $3,200 | $13,540 |
| 2023 | $2,077 | $16,740 | $3,200 | $13,540 |
| 2022 | $2,080 | $16,740 | $3,200 | $13,540 |
| 2020 | $2,143 | $25,110 | $4,800 | $20,310 |
| 2019 | $1,702 | $10,947 | $1,600 | $9,347 |
| 2018 | $1,671 | $10,947 | $1,600 | $9,347 |
| 2017 | $1,621 | $10,947 | $1,600 | $9,347 |
| 2016 | $1,606 | $10,947 | $1,600 | $9,347 |
| 2014 | $1,347 | $9,600 | $1,600 | $8,000 |
| 2013 | -- | $11,490 | $1,600 | $9,890 |
Source: Public Records
Map
Nearby Homes
- 240 Misty Oaks Ct
- 382 Oliver Metz Rd
- TBD Baron Rd
- 779 Hope Ferry Rd
- 338 Andrew Corley Rd
- 363 Andrew Corley Rd
- 819 Hope Ferry Rd
- 311 Andrew Corley Rd
- 140 Leonard Dr
- 122 Lupine Ct
- 310 Andrew Corley Rd
- 516 Midway Forest Trail
- 533 Midway Forest Trail
- 306 Andrew Corley Rd
- 930 Corley Mill Rd
- 0 Bent Ridge Ct
- 0 Center Dr Carolina Cr
- 261 Popes Ln
- 247 Saxons Ferry Dr
- 108 Sir Edwards Ln
- 107 Oaks Ct
- 208 Misty Oaks Ct
- 122 Misty Oaks Ct
- 104 Oaks Ct
- 207 Misty Oaks Ct
- 201 Misty Oaks Ct
- 111 Oaks Ct
- 212 Misty Oaks Ct
- 211 Misty Oaks Ct
- 112 Oaks Ct
- 112 Oaks Ct
- 106 Misty Oaks Place
- 115 Oaks Ct
- 115 Oaks Ct
- 1223 Corley Mill Rd
- 112 Misty Oaks Place
- 99 Misty Oaks Place
- 101 Misty Oaks Place
- 115 Misty Oaks Ct
- 220 Misty Oaks Ct