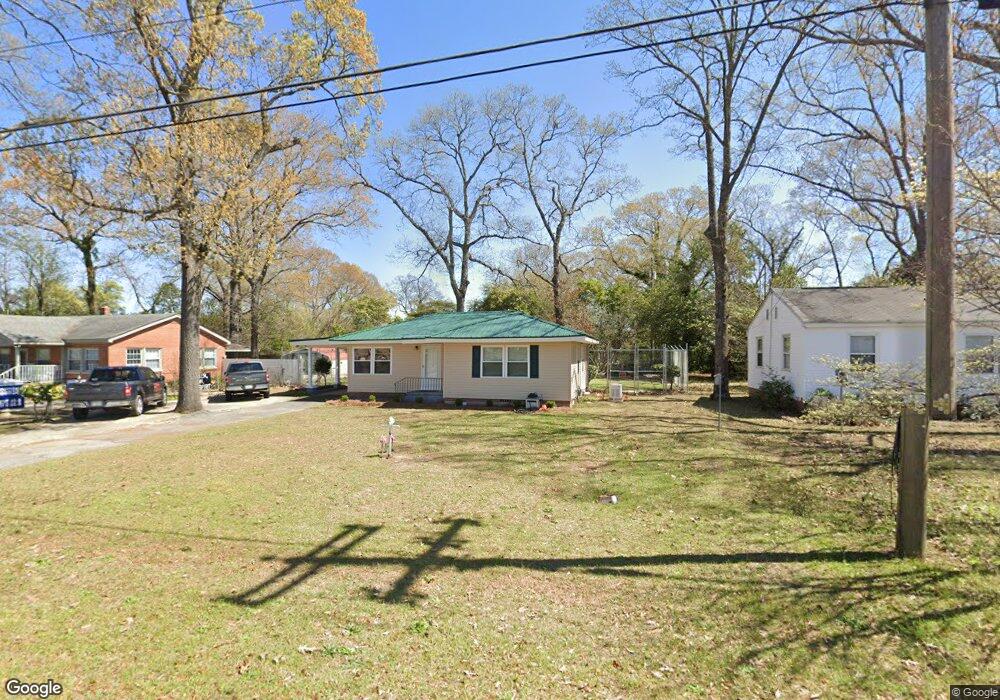
204 Myrtle St Warner Robins, GA 31093
Estimated Value: $70,000 - $120,000
Studio
1
Bath
885
Sq Ft
$107/Sq Ft
Est. Value
About This Home
This home is located at 204 Myrtle St, Warner Robins, GA 31093 and is currently estimated at $94,777, approximately $107 per square foot. 204 Myrtle St is a home located in Houston County with nearby schools including C. B. Watson Primary School, Pearl Stephens Elementary School, and Huntington Middle School.
Ownership History
Date
Name
Owned For
Owner Type
Purchase Details
Closed on
Mar 11, 1994
Sold by
Lynn Mark A and Lynn Coleen
Bought by
Lynn Mark A and Lynn Colleen*
Current Estimated Value
Purchase Details
Closed on
May 13, 1991
Sold by
Watson Watson H and Watson Inez E
Bought by
Lynn Mark A and Lynn Coleen*
Purchase Details
Closed on
Mar 8, 1991
Sold by
Watson Van F
Bought by
Watson Watson H and Watson Inez E
Purchase Details
Closed on
Jan 24, 1985
Sold by
Watson Inez E
Bought by
Watson Van F
Purchase Details
Closed on
Jan 26, 1984
Sold by
Cauley Otis F
Bought by
Watson Van F and Watson Inez E
Purchase Details
Closed on
Sep 27, 1972
Sold by
Wilson Hazel M
Bought by
Cauley Otis F
Purchase Details
Closed on
Feb 29, 1972
Bought by
Wilson Hazel M
Purchase Details
Closed on
Dec 1, 1971
Sold by
Wilson William T Estate
Bought by
Wilson Hazel M
Purchase Details
Closed on
Feb 18, 1954
Bought by
Wilson William T and Wilson Hazel M
Create a Home Valuation Report for This Property
The Home Valuation Report is an in-depth analysis detailing your home's value as well as a comparison with similar homes in the area
Home Values in the Area
Average Home Value in this Area
Purchase History
| Date | Buyer | Sale Price | Title Company |
|---|---|---|---|
| Lynn Mark A | -- | -- | |
| Lynn Mark A | -- | -- | |
| Watson Watson H | -- | -- | |
| Watson Van F | -- | -- | |
| Watson Van F | -- | -- | |
| Cauley Otis F | -- | -- | |
| Wilson Hazel M | -- | -- | |
| Wilson Hazel M | -- | -- | |
| Wilson William T | -- | -- |
Source: Public Records
Tax History
| Year | Tax Paid | Tax Assessment Tax Assessment Total Assessment is a certain percentage of the fair market value that is determined by local assessors to be the total taxable value of land and additions on the property. | Land | Improvement |
|---|---|---|---|---|
| 2025 | $594 | $23,000 | $3,200 | $19,800 |
| 2024 | $640 | $20,960 | $2,160 | $18,800 |
| 2023 | $548 | $18,000 | $2,160 | $15,840 |
| 2022 | $329 | $16,320 | $2,160 | $14,160 |
| 2021 | $286 | $14,360 | $2,160 | $12,200 |
| 2020 | $149 | $14,920 | $2,160 | $12,760 |
| 2019 | $300 | $14,920 | $2,160 | $12,760 |
| 2018 | $300 | $14,920 | $2,160 | $12,760 |
| 2017 | $300 | $14,920 | $2,160 | $12,760 |
| 2016 | $301 | $14,920 | $2,160 | $12,760 |
| 2015 | -- | $14,920 | $2,160 | $12,760 |
| 2014 | -- | $15,600 | $2,160 | $13,440 |
| 2013 | -- | $15,600 | $2,160 | $13,440 |
Source: Public Records
Map
Nearby Homes
- 305 N 4th St
- 404 N 5th St
- 402 Lydick Ave
- 104 Lady Ln
- 301 Doyle St
- 920 Mcarthur Blvd
- 212 Arnold Blvd
- 100 Chuck Cir
- 201 Meadowdale Dr
- 207 Eaker Dr
- 212 Orchard Way
- 108 Southend Ave
- 215 Camellia Cir
- 113 Vernon Dr
- 309 N Pleasant Hill Rd
- 1730 Green St
- 2009 Green St
- 99 Green St Unit 101 Green Street
- 122 Jay Dr
- 106 Edna Place
Your Personal Tour Guide
Ask me questions while you tour the home.