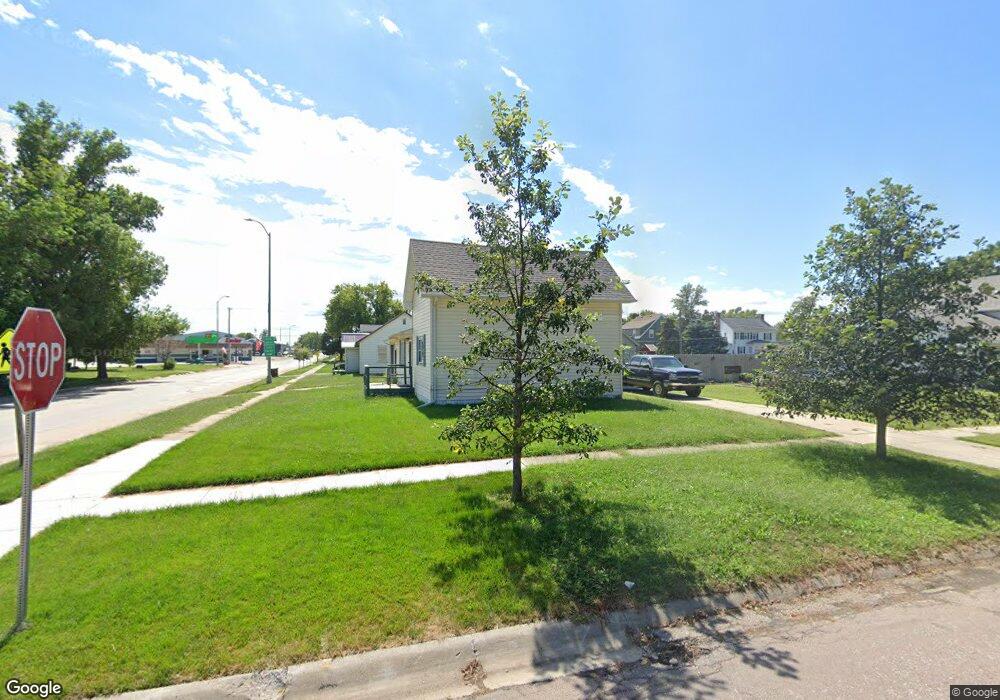
204 N 4th St Pender, NE 68047
Estimated Value: $105,000 - $173,000
Studio
--
Bath
1,214
Sq Ft
$109/Sq Ft
Est. Value
About This Home
This home is located at 204 N 4th St, Pender, NE 68047 and is currently estimated at $132,470, approximately $109 per square foot. 204 N 4th St is a home located in Thurston County with nearby schools including Pender Elementary School and Pender High School.
Ownership History
Date
Name
Owned For
Owner Type
Purchase Details
Closed on
Mar 4, 2022
Sold by
Rose Drew R and Rose Desiree R
Bought by
R5 Investments Llc
Current Estimated Value
Purchase Details
Closed on
Jan 11, 2022
Sold by
Hathaway Lindi A
Bought by
Rose Drew and Rose Desiree R
Purchase Details
Closed on
Dec 8, 2021
Sold by
Troyer Rick J and Troyer Vickie J
Bought by
Hathaway Lindi A
Purchase Details
Closed on
Mar 16, 2015
Sold by
Baldes Linda K
Bought by
Troyer Rick and Troyer Vickie
Create a Home Valuation Report for This Property
The Home Valuation Report is an in-depth analysis detailing your home's value as well as a comparison with similar homes in the area
Purchase History
| Date | Buyer | Sale Price | Title Company |
|---|---|---|---|
| R5 Investments Llc | -- | None Listed On Document | |
| Rose Drew | $72,000 | None Listed On Document | |
| Hathaway Lindi A | -- | None Listed On Document | |
| Troyer Rick | $38,500 | -- | |
| Tastad Ordine M | -- | -- |
Source: Public Records
Tax History
| Year | Tax Paid | Tax Assessment Tax Assessment Total Assessment is a certain percentage of the fair market value that is determined by local assessors to be the total taxable value of land and additions on the property. | Land | Improvement |
|---|---|---|---|---|
| 2025 | $1,400 | $91,875 | $6,000 | $85,875 |
| 2024 | $1,380 | $86,570 | $3,000 | $83,570 |
| 2023 | $1,564 | $78,980 | $3,000 | $75,980 |
| 2022 | $1,427 | $69,080 | $3,000 | $66,080 |
| 2021 | $1,051 | $53,285 | $3,000 | $50,285 |
| 2020 | $1,035 | $53,285 | $3,000 | $50,285 |
| 2019 | $914 | $48,715 | $3,000 | $45,715 |
| 2018 | $810 | $46,545 | $3,000 | $43,545 |
| 2017 | $775 | $46,545 | $3,000 | $43,545 |
| 2016 | $704 | $43,735 | $3,000 | $40,735 |
| 2015 | -- | $43,735 | $3,000 | $40,735 |
| 2014 | $761 | $43,735 | $3,000 | $40,735 |
| 2013 | -- | $37,390 | $3,000 | $34,390 |
Source: Public Records
Map
Nearby Homes
Your Personal Tour Guide
Ask me questions while you tour the home.