Estimated Value: $277,318
--
Bed
--
Bath
2,040
Sq Ft
$136/Sq Ft
Est. Value
About This Home
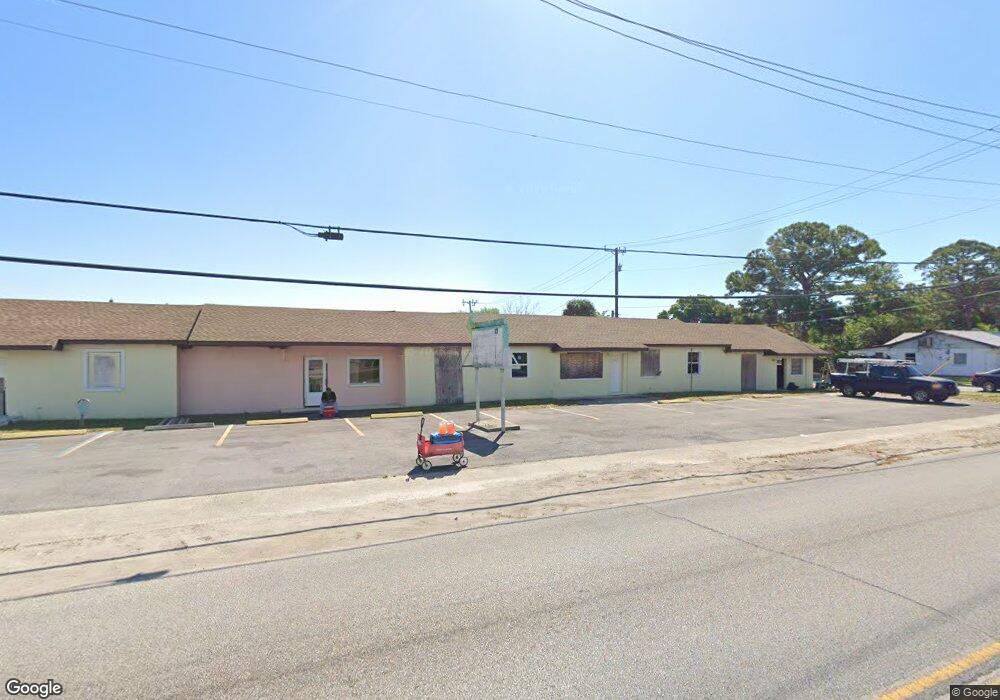
This home is located at 204 N Fiske Blvd Unit 5, Cocoa, FL 32922 and is currently priced at $277,318, approximately $135 per square foot. 204 N Fiske Blvd Unit 5 is a home located in Brevard County with nearby schools including Endeavour Elementary Magnet, Cocoa High School, and Emma Jewel Charter Academy.
Ownership History
Date
Name
Owned For
Owner Type
Purchase Details
Closed on
Oct 1, 2016
Bought by
Wilson Michael
Current Estimated Value
Purchase Details
Closed on
Mar 1, 2016
Bought by
Wilson Michael
Purchase Details
Closed on
Feb 10, 2014
Sold by
River Ranch Cattle Company Llc
Bought by
Toney Marlene and Toney Lorenzo
Home Financials for this Owner
Home Financials are based on the most recent Mortgage that was taken out on this home.
Original Mortgage
$125,000
Interest Rate
4.55%
Purchase Details
Closed on
Jun 14, 2010
Sold by
Real Estate Investment Depot Llc
Bought by
River Ranch Cattle Company Llc
Purchase Details
Closed on
Dec 2, 2007
Sold by
Mcneil Roni and Bennett Knight Properties
Bought by
Real Estate Investment Depot Llc
Purchase Details
Closed on
Oct 18, 2007
Sold by
Bennett Knight Properties
Bought by
Real Estate Investment Depot Llc
Create a Home Valuation Report for This Property
The Home Valuation Report is an in-depth analysis detailing your home's value as well as a comparison with similar homes in the area
Home Values in the Area
Average Home Value in this Area
Purchase History
| Date | Buyer | Sale Price | Title Company |
|---|---|---|---|
| Wilson Michael | $145,000 | -- | |
| Wilson Michael | $100 | -- | |
| Toney Marlene | $125,000 | Attorney | |
| River Ranch Cattle Company Llc | -- | Attorney | |
| Real Estate Investment Depot Llc | -- | Attorney | |
| Real Estate Investment Depot Llc | $32,000 | None Available |
Source: Public Records
Mortgage History
| Date | Status | Borrower | Loan Amount |
|---|---|---|---|
| Previous Owner | Toney Marlene | $125,000 |
Source: Public Records
Tax History Compared to Growth
Tax History
| Year | Tax Paid | Tax Assessment Tax Assessment Total Assessment is a certain percentage of the fair market value that is determined by local assessors to be the total taxable value of land and additions on the property. | Land | Improvement |
|---|---|---|---|---|
| 2025 | $2,633 | $112,710 | -- | -- |
| 2024 | $2,442 | $104,310 | -- | -- |
| 2023 | $2,442 | $94,140 | $13,920 | $80,220 |
| 2022 | $2,295 | $93,700 | $0 | $0 |
| 2021 | $2,275 | $94,480 | $13,920 | $80,560 |
| 2020 | $2,099 | $94,390 | $13,920 | $80,470 |
| 2019 | $1,887 | $72,150 | $13,920 | $58,230 |
| 2018 | $1,610 | $66,880 | $13,920 | $52,960 |
| 2017 | $1,540 | $61,000 | $0 | $61,000 |
| 2016 | $1,534 | $58,000 | $0 | $0 |
| 2015 | $1,441 | $53,000 | $10,010 | $42,990 |
| 2014 | $1,603 | $63,000 | $10,010 | $52,990 |
Source: Public Records
Map
Nearby Homes
- 919 Fern Ave
- 406 N Fiske Blvd
- 406 Prospect Ave
- 821 Peachtree St Unit D3
- 821 Peachtree St Unit B-12
- 1103 Bellefonte Ave
- 418 Churchill Dr
- 328 Bay Ave Unit A & B
- 824 Temple St
- 506 Stone St
- 351 Pine Ave
- 119 Explorer St
- 1237 Holmes St
- 1108 Bristol Dr
- 128 Aurora St
- Xxxx S Fiske Blvd
- 800 N Fiske Blvd Unit 815
- 800 N Fiske Blvd Unit 202
- 800 N Fiske Blvd Unit 713
- 800 N Fiske Blvd Unit 714
- 926 Grove Ave
- 931 School St
- 929 School St
- 927 School St Unit 927
- 927 School St
- 203 N Fiske Blvd
- 935 School St
- 927 Grove Ave
- 925 School St Unit 925
- 925 School St
- 924 Grove Ave
- 112 N Fiske Blvd
- 923 School St Unit 923
- 923 School St
- 921 School St
- 923 Grove Ave
- 1034 Grove Ave
- 919 School St
- 922 Grove Ave
- 108 N Fiske Blvd