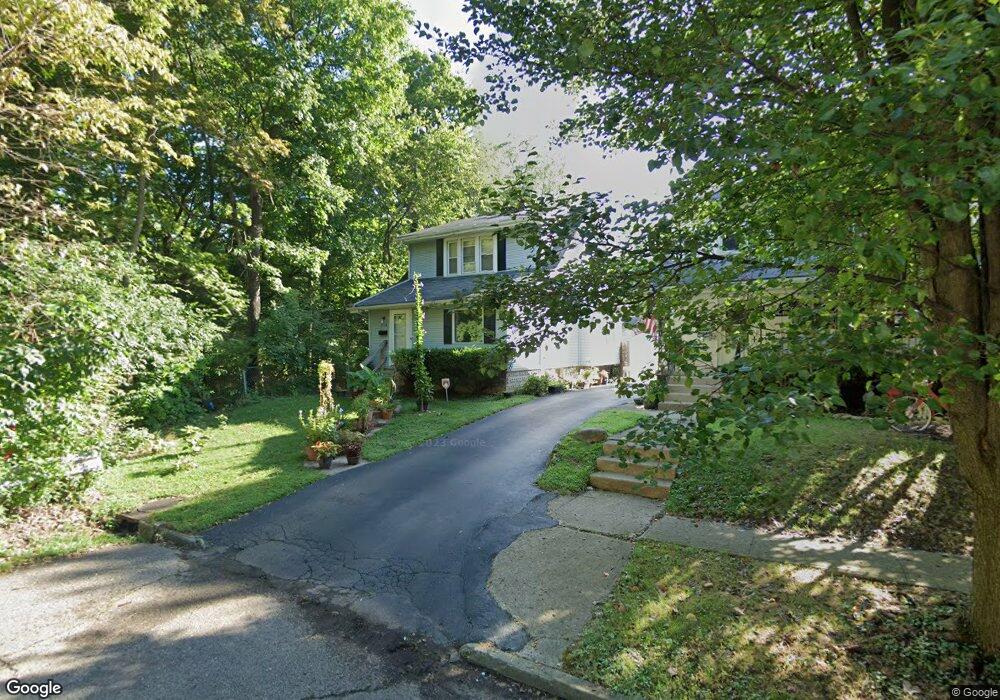
204 N Roys Ave Columbus, OH 43204
North Hilltop NeighborhoodEstimated Value: $165,126 - $184,000
2
Beds
1
Bath
984
Sq Ft
$180/Sq Ft
Est. Value
About This Home
This home is located at 204 N Roys Ave, Columbus, OH 43204 and is currently estimated at $176,782, approximately $179 per square foot. 204 N Roys Ave is a home located in Franklin County with nearby schools including West Broad Elementary School, Westmoor Middle School, and West High School.
Ownership History
Date
Name
Owned For
Owner Type
Purchase Details
Closed on
Jun 25, 2021
Sold by
Lucas Andrew and Lucas Andrew T
Bought by
Kiser Omar and Kiser Shawn M
Current Estimated Value
Home Financials for this Owner
Home Financials are based on the most recent Mortgage that was taken out on this home.
Original Mortgage
$137,750
Outstanding Balance
$124,987
Interest Rate
2.9%
Mortgage Type
New Conventional
Estimated Equity
$51,795
Purchase Details
Closed on
Jul 20, 2016
Sold by
Lucas Andrew
Bought by
Wise Jeffrey N
Purchase Details
Closed on
Oct 2, 2003
Sold by
Washington Mutual Bank
Bought by
Lucas Andrew and Lucas Andrew T
Home Financials for this Owner
Home Financials are based on the most recent Mortgage that was taken out on this home.
Original Mortgage
$46,100
Interest Rate
5.81%
Mortgage Type
Purchase Money Mortgage
Purchase Details
Closed on
Mar 7, 2003
Sold by
Cutlip Melanie L and Case #01Cve11 11623
Bought by
Washington Mutual Bank
Purchase Details
Closed on
Jun 5, 1987
Bought by
Cutlip Melanie L
Purchase Details
Closed on
Sep 1, 1984
Purchase Details
Closed on
Mar 1, 1984
Create a Home Valuation Report for This Property
The Home Valuation Report is an in-depth analysis detailing your home's value as well as a comparison with similar homes in the area
Home Values in the Area
Average Home Value in this Area
Purchase History
| Date | Buyer | Sale Price | Title Company |
|---|---|---|---|
| Kiser Omar | $145,000 | Ohio Real Title Agency Llc | |
| Wise Jeffrey N | -- | None Available | |
| Lucas Andrew | $57,700 | -- | |
| Washington Mutual Bank | $75,000 | -- | |
| Cutlip Melanie L | $52,000 | -- | |
| -- | -- | -- | |
| -- | -- | -- |
Source: Public Records
Mortgage History
| Date | Status | Borrower | Loan Amount |
|---|---|---|---|
| Open | Kiser Omar | $137,750 | |
| Previous Owner | Lucas Andrew | $46,100 |
Source: Public Records
Tax History Compared to Growth
Tax History
| Year | Tax Paid | Tax Assessment Tax Assessment Total Assessment is a certain percentage of the fair market value that is determined by local assessors to be the total taxable value of land and additions on the property. | Land | Improvement |
|---|---|---|---|---|
| 2024 | $2,080 | $46,350 | $8,510 | $37,840 |
| 2023 | $2,054 | $46,340 | $8,505 | $37,835 |
| 2022 | $1,504 | $28,990 | $7,250 | $21,740 |
| 2021 | $1,543 | $28,990 | $7,250 | $21,740 |
| 2020 | $1,546 | $28,990 | $7,250 | $21,740 |
| 2019 | $1,491 | $23,980 | $6,060 | $17,920 |
| 2018 | $1,001 | $23,980 | $6,060 | $17,920 |
| 2017 | $1,491 | $23,980 | $6,060 | $17,920 |
| 2016 | $564 | $8,300 | $4,340 | $3,960 |
| 2015 | $513 | $8,300 | $4,340 | $3,960 |
| 2014 | $515 | $8,300 | $4,340 | $3,960 |
| 2013 | $282 | $9,205 | $4,830 | $4,375 |
Source: Public Records
Map
Nearby Homes
- 184 N Roys Ave
- 162 S Roys Ave
- 154-156 N Huron Ave
- 65 N Chase Ave
- 104-106 N Hague Ave
- 200-202 N Harris Ave
- 166 N Harris Ave
- 75 N Huron Ave
- 87 N Warren Ave
- 3100 Steele Ave
- 119 N Westgate Ave
- 58 Binns Blvd
- 118 N Ogden Ave
- 66 N Brinker Ave
- 113 N Brinker Ave Unit 115
- 65 S Hague Ave
- 127 N Burgess Ave
- 3096 Ellis Place
- 298 N Burgess Ave
- 527 N Hague Ave
- 200 N Roys Ave
- 194 N Roys Ave
- 188 N Roys Ave Unit 190
- 188-190 N Roys Ave
- 211 N Chase Ave
- 205 N Chase Ave
- 217 N Chase Ave
- 201 N Chase Ave
- 197 N Roys Ave
- 178 N Roys Ave
- 187-193 N Roys Ave
- 195 N Chase Ave
- 187 N Roys Ave
- 187 N Roys Ave Unit 193
- 172 N Roys Ave
- 181 N Roys Ave
- 185 N Chase Ave
- 175 N Roys Ave
- 168 S Roys Ave
- 168 N Roys Ave