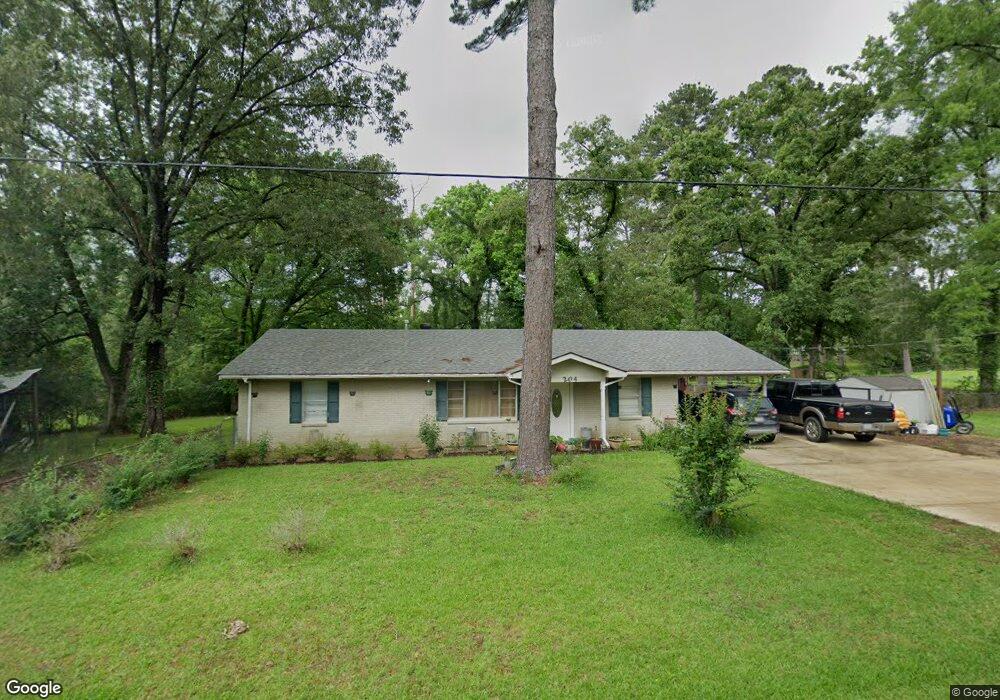
204 Nalley Dr Pineville, LA 71360
Estimated Value: $149,614 - $180,000
3
Beds
2
Baths
1,307
Sq Ft
$125/Sq Ft
Est. Value
About This Home
This home is located at 204 Nalley Dr, Pineville, LA 71360 and is currently estimated at $162,904, approximately $124 per square foot. 204 Nalley Dr is a home located in Rapides Parish with nearby schools including J.I. Barron Sr. Elementary School, Pineville Junior High School, and Pineville High School.
Ownership History
Date
Name
Owned For
Owner Type
Purchase Details
Closed on
Jul 8, 2016
Sold by
Lejeune E J
Bought by
Brown Sean P and Brown Jocy M
Current Estimated Value
Home Financials for this Owner
Home Financials are based on the most recent Mortgage that was taken out on this home.
Original Mortgage
$112,917
Outstanding Balance
$89,170
Interest Rate
3.25%
Mortgage Type
FHA
Estimated Equity
$73,734
Purchase Details
Closed on
Jun 21, 2007
Sold by
Ritchie Cleveland Lamar
Bought by
Lejeune E J
Home Financials for this Owner
Home Financials are based on the most recent Mortgage that was taken out on this home.
Original Mortgage
$112,365
Interest Rate
6.37%
Mortgage Type
VA
Purchase Details
Closed on
Jan 19, 2005
Sold by
Jpmorgan Chase Bank N A
Bought by
Ritchie Cleveland Lamar and Roberts Ritchie Sylvia
Create a Home Valuation Report for This Property
The Home Valuation Report is an in-depth analysis detailing your home's value as well as a comparison with similar homes in the area
Home Values in the Area
Average Home Value in this Area
Purchase History
| Date | Buyer | Sale Price | Title Company |
|---|---|---|---|
| Brown Sean P | $115,000 | Commonwealth Land Title | |
| Lejeune E J | $110,000 | None Available | |
| Ritchie Cleveland Lamar | $21,000 | None Available |
Source: Public Records
Mortgage History
| Date | Status | Borrower | Loan Amount |
|---|---|---|---|
| Open | Brown Sean P | $112,917 | |
| Previous Owner | Lejeune E J | $112,365 |
Source: Public Records
Tax History Compared to Growth
Tax History
| Year | Tax Paid | Tax Assessment Tax Assessment Total Assessment is a certain percentage of the fair market value that is determined by local assessors to be the total taxable value of land and additions on the property. | Land | Improvement |
|---|---|---|---|---|
| 2024 | $606 | $11,900 | $400 | $11,500 |
| 2023 | $556 | $11,500 | $400 | $11,100 |
| 2022 | $1,621 | $11,500 | $400 | $11,100 |
| 2021 | $1,627 | $11,500 | $400 | $11,100 |
| 2020 | $1,626 | $11,500 | $400 | $11,100 |
| 2019 | $1,565 | $11,500 | $400 | $11,100 |
| 2018 | $559 | $11,500 | $400 | $11,100 |
| 2017 | $559 | $11,500 | $400 | $11,100 |
| 2016 | $1,606 | $11,500 | $400 | $11,100 |
| 2015 | $1,727 | $11,880 | $420 | $11,460 |
| 2014 | $1,745 | $11,880 | $420 | $11,460 |
| 2013 | $1,748 | $11,880 | $420 | $11,460 |
Source: Public Records
Map
Nearby Homes
- 136 Nalley Dr
- 205 Nalley Dr
- 0 Old Marksville Hwy
- 204 Nickolas Other
- 2716 Patty Ave
- 209 Chloe Rd
- 110 Seneca Ct
- 237 Wainwright Rd
- 211 Wainwright Rd
- 195 Wainwright Rd
- 229 Wainwright Rd
- Lot 2 - 0 Stilley Rd
- Lot 1 - 0 Stilley Rd
- 302 Wainwright Rd
- 200 Adams Path
- 3343 Old Marksville Hwy
- 0 Crestview Dr
- 15.4 Acres Louisiana 107
- 10.4 Acres Louisiana 107
- 3392 La 28 Hwy E
- 2936 Airline Blvd
- 142 Nalley Dr
- 2935 Airline Blvd
- 210 Nalley Dr
- 138 Nalley Dr
- 2923 Airline Blvd
- 139 Nalley Dr
- 214 Nalley Dr
- 2920 Old Marksville Hwy
- 135 Nalley Dr
- 2925 Airline Blvd
- 3011 Airline Blvd
- 211 Nalley Dr
- 3014 Airline Blvd
- 3018 Airline Blvd
- 2921 Airline Blvd
- 3002 Old Marksville Hwy
- 211 Branton Dr
- 3015 Airline Blvd
- 3019 Airline Blvd