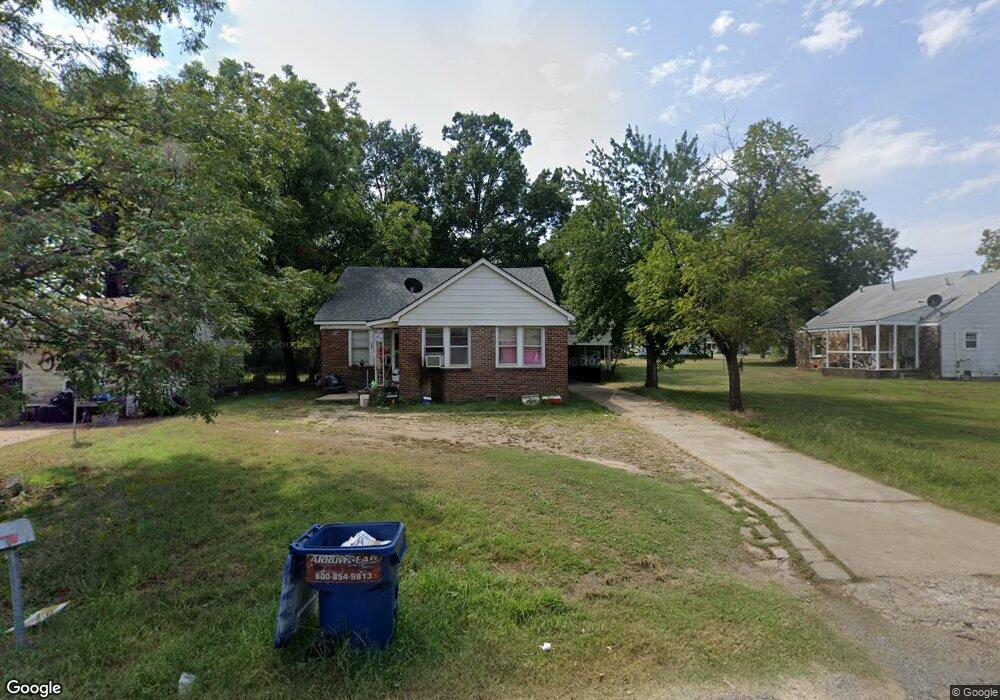
204 NE C St Stigler, OK 74462
Estimated Value: $80,000 - $94,000
3
Beds
1
Bath
1,160
Sq Ft
$75/Sq Ft
Est. Value
About This Home
This home is located at 204 NE C St, Stigler, OK 74462 and is currently estimated at $86,925, approximately $74 per square foot. 204 NE C St is a home located in Haskell County with nearby schools including Stigler Elementary School, Stigler Middle School, and Stigler High School.
Ownership History
Date
Name
Owned For
Owner Type
Purchase Details
Closed on
Dec 16, 2022
Sold by
Ruiz-Lopez Jose A
Bought by
Lopez Alejandra Perez and Lopez Henry Hayden
Current Estimated Value
Purchase Details
Closed on
Oct 26, 2017
Sold by
Stevens Rick and Stevens Angela
Bought by
Mann Harvey and Mann Cheryl
Purchase Details
Closed on
Jun 1, 2015
Sold by
Mann Annabel
Bought by
Mann Harvey and Mann Cheryl
Purchase Details
Closed on
Feb 23, 2012
Sold by
Bond David
Bought by
Mann Harvey and Mann Cheryl
Purchase Details
Closed on
Jul 17, 2009
Sold by
Mann Harvey and Mann Cheryl
Bought by
Bond David
Purchase Details
Closed on
Jul 1, 2009
Sold by
Thompson Mary Ann
Bought by
Mann Harvey and Mann Cheryl
Purchase Details
Closed on
Mar 19, 2008
Sold by
Mann Harvey and Mann Cheryl
Bought by
Thompson Mary Ann
Create a Home Valuation Report for This Property
The Home Valuation Report is an in-depth analysis detailing your home's value as well as a comparison with similar homes in the area
Home Values in the Area
Average Home Value in this Area
Purchase History
| Date | Buyer | Sale Price | Title Company |
|---|---|---|---|
| Lopez Alejandra Perez | -- | -- | |
| Lopez Jose A Ruiz | -- | -- | |
| Mann Harvey | $45,000 | None Available | |
| Mann Harvey | -- | -- | |
| Mann Harvey | -- | -- | |
| Bond David | $55,000 | -- | |
| Mann Harvey | -- | -- | |
| Thompson Mary Ann | $54,000 | -- | |
| Mann Harvey | -- | -- |
Source: Public Records
Tax History Compared to Growth
Tax History
| Year | Tax Paid | Tax Assessment Tax Assessment Total Assessment is a certain percentage of the fair market value that is determined by local assessors to be the total taxable value of land and additions on the property. | Land | Improvement |
|---|---|---|---|---|
| 2025 | $389 | $5,317 | $660 | $4,657 |
| 2024 | $389 | $5,065 | $660 | $4,405 |
| 2023 | $371 | $4,824 | $1,117 | $3,707 |
| 2022 | $371 | $4,824 | $1,117 | $3,707 |
| 2021 | $371 | $4,824 | $1,117 | $3,707 |
| 2020 | $371 | $4,824 | $1,117 | $3,707 |
| 2019 | $375 | $4,825 | $1,117 | $3,708 |
| 2018 | $385 | $4,951 | $1,117 | $3,834 |
| 2017 | $372 | $4,777 | $1,117 | $3,660 |
| 2016 | $377 | $4,864 | $1,117 | $3,747 |
| 2015 | $462 | $5,940 | $1,100 | $4,840 |
| 2014 | $464 | $5,940 | $1,100 | $4,840 |
Source: Public Records
Map
Nearby Homes