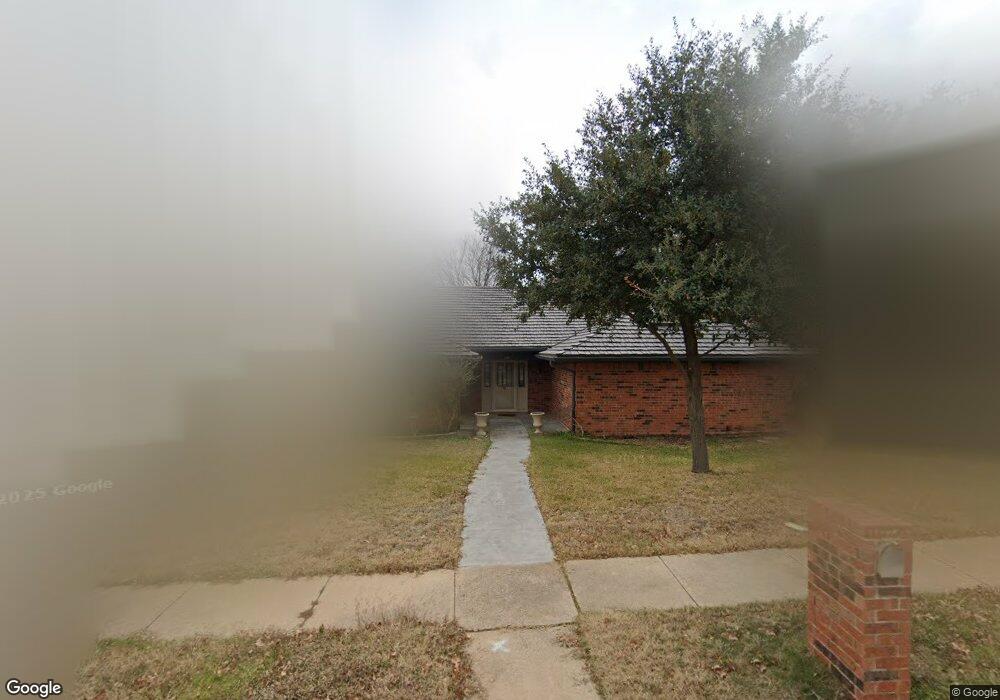
204 Norfolk Dr Bedford, TX 76021
Estimated Value: $423,403 - $487,000
4
Beds
2
Baths
2,480
Sq Ft
$187/Sq Ft
Est. Value
About This Home
This home is located at 204 Norfolk Dr, Bedford, TX 76021 and is currently estimated at $464,851, approximately $187 per square foot. 204 Norfolk Dr is a home located in Tarrant County with nearby schools including Bedford Heights Elementary School, Bedford Junior High School, and L.D. Bell High School.
Ownership History
Date
Name
Owned For
Owner Type
Purchase Details
Closed on
Jun 15, 2021
Sold by
Hoang Hao Cao
Bought by
Hoang Daniel V
Current Estimated Value
Home Financials for this Owner
Home Financials are based on the most recent Mortgage that was taken out on this home.
Original Mortgage
$200,000
Outstanding Balance
$181,075
Interest Rate
2.9%
Mortgage Type
New Conventional
Estimated Equity
$283,776
Purchase Details
Closed on
Nov 8, 2020
Sold by
Hoang Huong Bui
Bought by
Hoang Hao Cao
Purchase Details
Closed on
May 25, 1994
Sold by
Parent Terrence P and Parent Terry L
Bought by
Hoang Hao C and Hoang Huong B
Home Financials for this Owner
Home Financials are based on the most recent Mortgage that was taken out on this home.
Original Mortgage
$75,000
Interest Rate
8.45%
Create a Home Valuation Report for This Property
The Home Valuation Report is an in-depth analysis detailing your home's value as well as a comparison with similar homes in the area
Home Values in the Area
Average Home Value in this Area
Purchase History
| Date | Buyer | Sale Price | Title Company |
|---|---|---|---|
| Hoang Daniel V | -- | Capital Title Of Texas Llc | |
| Hoang Hao Cao | -- | None Available | |
| Hoang Hao C | -- | American Title Company |
Source: Public Records
Mortgage History
| Date | Status | Borrower | Loan Amount |
|---|---|---|---|
| Open | Hoang Daniel V | $200,000 | |
| Closed | Hoang Hao C | $75,000 |
Source: Public Records
Tax History Compared to Growth
Tax History
| Year | Tax Paid | Tax Assessment Tax Assessment Total Assessment is a certain percentage of the fair market value that is determined by local assessors to be the total taxable value of land and additions on the property. | Land | Improvement |
|---|---|---|---|---|
| 2025 | $5,963 | $306,857 | $75,000 | $231,857 |
| 2024 | $5,963 | $373,000 | $75,000 | $298,000 |
| 2023 | $7,152 | $384,665 | $55,000 | $329,665 |
| 2022 | $7,404 | $339,000 | $55,000 | $284,000 |
| 2021 | $6,607 | $308,180 | $55,000 | $253,180 |
| 2020 | $6,063 | $255,000 | $55,000 | $200,000 |
| 2019 | $6,195 | $255,000 | $55,000 | $200,000 |
| 2018 | $5,364 | $236,500 | $55,000 | $181,500 |
| 2017 | $5,201 | $215,000 | $18,000 | $197,000 |
| 2016 | $5,008 | $215,453 | $18,000 | $197,453 |
| 2015 | $4,594 | $188,200 | $18,000 | $170,200 |
| 2014 | $4,594 | $193,900 | $18,000 | $175,900 |
Source: Public Records
Map
Nearby Homes
- 320 Blue Quail Ct
- 432 Sunnybrook Ct
- 305 Warbler Dr
- 121 Kay Ct
- 405 Woodbriar Ct
- 124 Jeannie Ct
- 404 Heather Ln
- 3213 Spring Valley Dr
- 421 Cavender Ct
- 1732 Jeannie Ln
- 2212 Mountainview Dr
- 3119 Spring Grove Dr
- 2212 Hurstview Dr
- 817 Shady Lake Dr
- 2244 Hurstview Dr
- 801 Shady Creek Ln
- 1740 Brown Trail
- 3605 Spring Valley Dr
- 3713 Brentwood Ct
- 2436 Brookgreen Ct
- 208 Norfolk Dr
- 3008 Shenandoah Dr
- 217 Carolyn Dr
- 3004 Shenandoah Dr
- 221 Carolyn Dr
- 212 Norfolk Dr
- 205 Norfolk Dr
- 3016 Shenandoah Dr
- 3000 Shenandoah Dr
- 209 Norfolk Dr
- 225 Carolyn Dr
- 213 Norfolk Dr
- 3020 Shenandoah Dr
- 3009 Shenandoah Dr
- 3013 Shenandoah Dr
- 204 Stanford Dr
- 3005 Shenandoah Dr
- 216 Carolyn Dr
- 208 Stanford Dr
- 3017 Shenandoah Dr