Estimated Value: $298,000 - $321,000
3
Beds
2
Baths
1,726
Sq Ft
$180/Sq Ft
Est. Value
About This Home
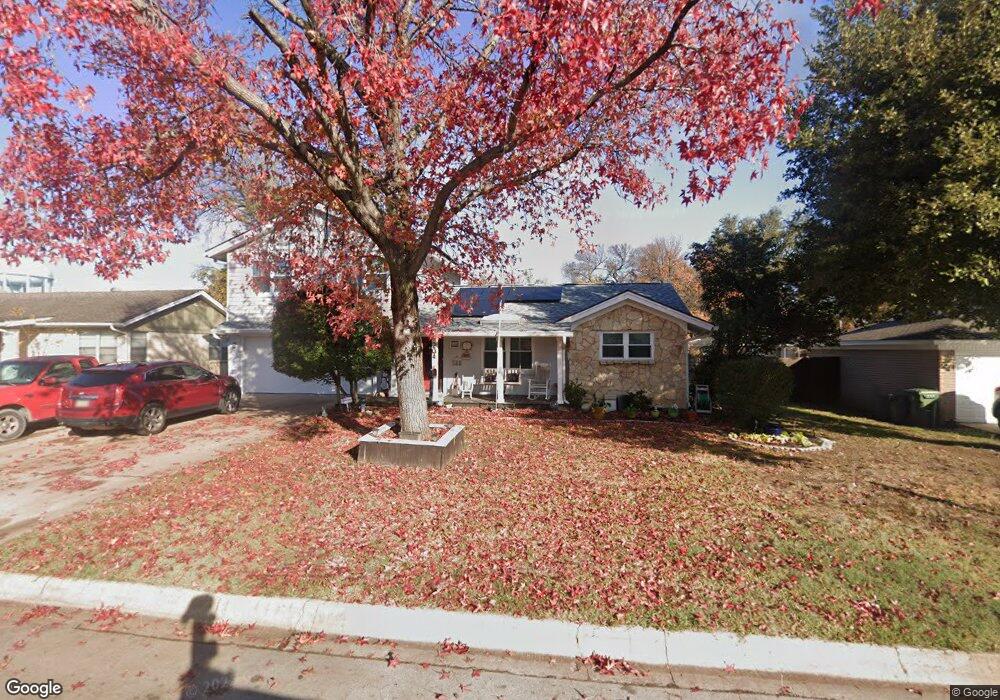
This home is located at 204 Olive St, Hurst, TX 76053 and is currently estimated at $309,995, approximately $179 per square foot. 204 Olive St is a home located in Tarrant County with nearby schools including Harrison Lane Elementary School, Hurst J High School, and L.D. Bell High School.
Ownership History
Date
Name
Owned For
Owner Type
Purchase Details
Closed on
May 21, 1998
Sold by
Cox Jeffrey S and Cox Wendy Lynne
Bought by
Black Michael J and Black Penny K
Current Estimated Value
Home Financials for this Owner
Home Financials are based on the most recent Mortgage that was taken out on this home.
Original Mortgage
$96,250
Outstanding Balance
$15,685
Interest Rate
7.2%
Mortgage Type
FHA
Estimated Equity
$294,310
Purchase Details
Closed on
Oct 28, 1994
Sold by
Cate Bill and Cate Becki
Bought by
Cox Jeffery S and Cox Wendy Lynne
Home Financials for this Owner
Home Financials are based on the most recent Mortgage that was taken out on this home.
Original Mortgage
$85,680
Interest Rate
8.62%
Mortgage Type
VA
Create a Home Valuation Report for This Property
The Home Valuation Report is an in-depth analysis detailing your home's value as well as a comparison with similar homes in the area
Home Values in the Area
Average Home Value in this Area
Purchase History
We collect this data history from publicly available records. To have your information removed, we recommend requesting removal directly through your county’s website.
| Date | Buyer | Sale Price | Title Company |
|---|---|---|---|
| Black Michael J | -- | Alamo Title Co | |
| Cox Jeffery S | -- | Commonwealth Land Title |
Source: Public Records
Mortgage History
We collect this data history from publicly available records. To have your information removed, we recommend requesting removal directly through your county’s website.
| Date | Status | Borrower | Loan Amount |
|---|---|---|---|
| Open | Black Michael J | $96,250 | |
| Previous Owner | Cox Jeffery S | $85,680 |
Source: Public Records
Tax History
| Year | Tax Paid | Tax Assessment Tax Assessment Total Assessment is a certain percentage of the fair market value that is determined by local assessors to be the total taxable value of land and additions on the property. | Land | Improvement |
|---|---|---|---|---|
| 2025 | $1,440 | $307,744 | $55,000 | $252,744 |
| 2024 | $1,440 | $307,744 | $55,000 | $252,744 |
| 2023 | $1,489 | $295,001 | $40,000 | $255,001 |
| 2022 | $5,384 | $259,414 | $40,000 | $219,414 |
| 2021 | $5,127 | $225,554 | $40,000 | $185,554 |
| 2020 | $4,650 | $195,973 | $40,000 | $155,973 |
| 2019 | $4,300 | $197,444 | $40,000 | $157,444 |
| 2018 | $3,342 | $159,720 | $19,000 | $140,720 |
| 2017 | $3,674 | $189,627 | $19,000 | $170,627 |
| 2016 | $3,340 | $177,938 | $19,000 | $158,938 |
| 2015 | $2,726 | $120,000 | $15,000 | $105,000 |
| 2014 | $2,726 | $120,000 | $15,000 | $105,000 |
Source: Public Records
Map
Nearby Homes
- 201 Olive St
- 1160 Harrison Ln
- 1144 Norwood Dr
- 1140 Cavender Dr
- 404 Glenwood Terrace
- 413 Patricia Rd
- 1352 Simpson Dr
- 905 Brown Trail
- 1112 Karla Dr
- 153 Sheri Ln
- 1229 Brookside Dr
- 1328 Brookside Dr
- 341 Hurst Dr
- 224 Plainview Dr
- 802 Brown Trail
- 727 Norwood Dr
- 905 Hurstview Dr
- 716 Norwood Dr
- 60 Somerset Terrace
- 100 W Pleasantview Dr
- 208 Olive St
- 200 Olive St
- 1201 Harrison Ln
- 212 Olive St
- 1205 Harrison Ln
- 205 Olive St
- 209 Olive St
- 216 Olive St
- 1168 Harrison Ln
- 1172 Harrison Ln
- 1164 Harrison Ln
- 1209 Harrison Ln
- 213 Olive St
- 1200 Harrison Ln
- 1204 Harrison Ln
- 217 Olive St
- 220 Olive St
- 1213 Harrison Ln
- 1149 Harrison Ln
- 1156 Harrison Ln
Your Personal Tour Guide
Ask me questions while you tour the home.