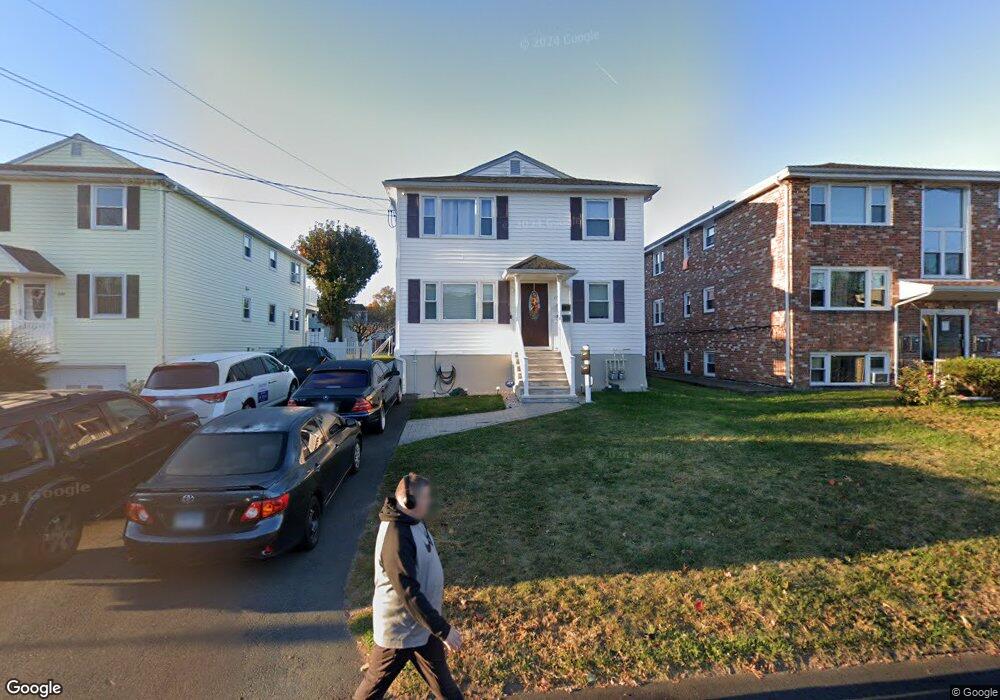
204 Overlook Ave New Britain, CT 06053
Estimated Value: $418,000 - $813,533
6
Beds
2
Baths
2,496
Sq Ft
$217/Sq Ft
Est. Value
About This Home
This home is located at 204 Overlook Ave, New Britain, CT 06053 and is currently estimated at $540,883, approximately $216 per square foot. 204 Overlook Ave is a home located in Hartford County with nearby schools including Jefferson School, Pulaski Middle School, and Mountain Laurel Sudbury School.
Ownership History
Date
Name
Owned For
Owner Type
Purchase Details
Closed on
Aug 1, 2016
Sold by
Raspet Eric
Bought by
Flader Tomasz and Mahar Michelle
Current Estimated Value
Home Financials for this Owner
Home Financials are based on the most recent Mortgage that was taken out on this home.
Original Mortgage
$215,650
Outstanding Balance
$172,396
Interest Rate
3.54%
Mortgage Type
Purchase Money Mortgage
Estimated Equity
$368,487
Purchase Details
Closed on
Oct 1, 2009
Sold by
Hsbc Bank Usa
Bought by
Raspet Eva and Raspet Eric
Home Financials for this Owner
Home Financials are based on the most recent Mortgage that was taken out on this home.
Original Mortgage
$196,377
Interest Rate
5.12%
Purchase Details
Closed on
Jun 26, 2009
Sold by
Sarat Arthur J
Bought by
Hsbc Bank Usa Tr
Purchase Details
Closed on
Oct 31, 1996
Sold by
Krenich Stanley and Krenich Danuta
Bought by
Sarat Artur J and Sarat Beata K
Create a Home Valuation Report for This Property
The Home Valuation Report is an in-depth analysis detailing your home's value as well as a comparison with similar homes in the area
Home Values in the Area
Average Home Value in this Area
Purchase History
| Date | Buyer | Sale Price | Title Company |
|---|---|---|---|
| Flader Tomasz | $387,500 | -- | |
| Raspet Eva | $200,000 | -- | |
| Hsbc Bank Usa Tr | -- | -- | |
| Sarat Artur J | $108,000 | -- |
Source: Public Records
Mortgage History
| Date | Status | Borrower | Loan Amount |
|---|---|---|---|
| Open | Flader Tomasz | $215,650 | |
| Previous Owner | Sarat Artur J | $196,377 | |
| Previous Owner | Sarat Artur J | $247,000 |
Source: Public Records
Tax History Compared to Growth
Tax History
| Year | Tax Paid | Tax Assessment Tax Assessment Total Assessment is a certain percentage of the fair market value that is determined by local assessors to be the total taxable value of land and additions on the property. | Land | Improvement |
|---|---|---|---|---|
| 2025 | $7,690 | $196,280 | $51,870 | $144,410 |
| 2024 | $7,771 | $196,280 | $51,870 | $144,410 |
| 2023 | $7,514 | $196,280 | $51,870 | $144,410 |
| 2022 | $6,622 | $133,770 | $21,840 | $111,930 |
| 2021 | $6,622 | $133,770 | $21,840 | $111,930 |
| 2020 | $6,755 | $133,770 | $21,840 | $111,930 |
| 2019 | $6,755 | $133,770 | $21,840 | $111,930 |
| 2018 | $6,755 | $133,770 | $21,840 | $111,930 |
| 2017 | $6,946 | $137,550 | $21,840 | $115,710 |
| 2016 | $6,946 | $137,550 | $21,840 | $115,710 |
| 2015 | $6,740 | $137,550 | $21,840 | $115,710 |
| 2014 | $6,740 | $137,550 | $21,840 | $115,710 |
Source: Public Records
Map
Nearby Homes
- 148 Governor St
- 152 Oakland Ave
- 95 Pierremount Ave
- 234 Pierremount Ave
- 59 Heather Ln
- 410 Farmington Ave Unit O6
- 67 Eastwick Rd
- 394 Mcclintock St
- 108 Commonwealth Ave
- 27 Candlewood Ln
- 19 Maplehurst Ave
- 34 Hutchinson St
- 55 Allen St
- 83 Kim Dr
- 34 Concord St
- 107 Allen St
- 258 Eddy Glover Blvd
- 154 Allen St
- 50 Curtin Ave
- 34 Oneida St
- 200 Overlook Ave
- 200 Overlook Ave Unit 2
- 194 Overlook Ave
- 216 Overlook Ave
- 190 Overlook Ave
- 211 Oakland Ave
- 217 Oakland Ave
- 203 Overlook Ave
- 203 Oakland Ave
- 222 Overlook Ave
- 211 Overlook Ave
- 184 Overlook Ave
- 225 Oakland Ave
- 151 Jordan St
- 195 Oakland Ave
- 187 Overlook Ave
- 225 Overlook Ave
- 180 Overlook Ave
- 192 Governor St
- 196 Governor St