Estimated payment $2,953/month
Highlights
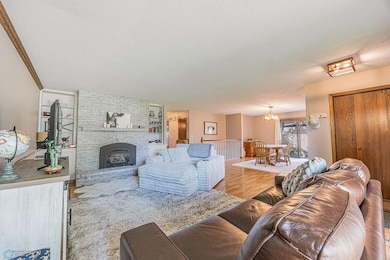
- Fireplace
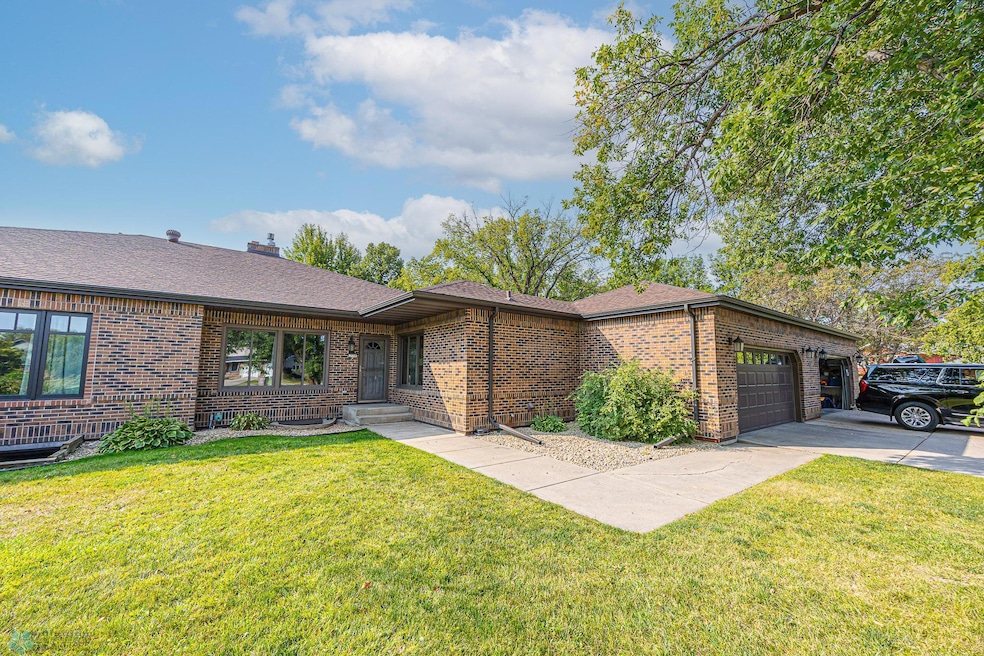
- 2 Car Attached Garage
- Living Room
- Kindred Elementary School Rated A
- Patio
- Laundry Room
About This Home
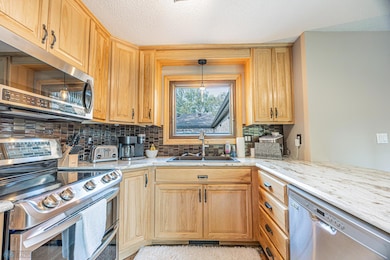
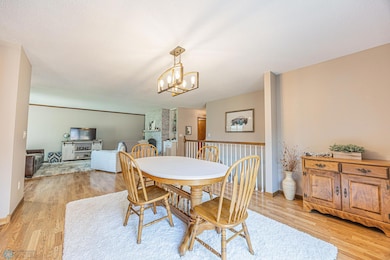
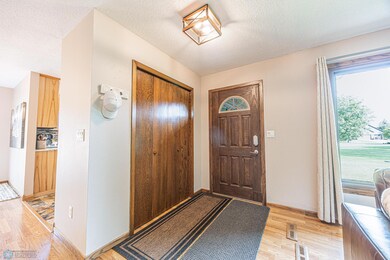
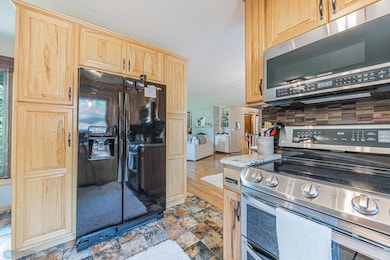
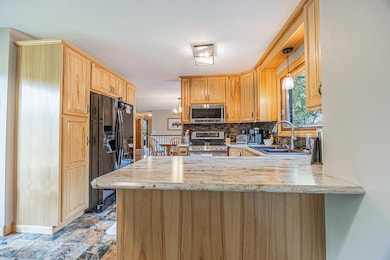
Welcome home to 204 Oxbow Circle! This all brick rambler is a must see with mature trees and minutes from Fargo and the Oxbow Country Club. The main floor hosts an open and spacious living area with a large living room with gas fireplace, dining room, large kitchen with hickory cabinets, master bedroom with full bath, 2nd bedroom and an additional full bathroom and a private patio. The lower level has a large rec/exercise room, family room, 3/4 bath room, bedroom and spacious utility room. Call your favorite realtor today for a showing!
Property Details
Home Type
- Condominium
Est. Annual Taxes
- $3,795
Year Built
- Built in 1978
HOA Fees
- $225 Monthly HOA Fees
Parking
- 2 Car Attached Garage
Interior Spaces
- 1-Story Property
- Fireplace
- Entrance Foyer
- Family Room
- Living Room
- Dining Room
- Laundry Room
- Basement
Kitchen
- Range
- Microwave
- Dishwasher
- Disposal
Bedrooms and Bathrooms
- 3 Bedrooms
Utilities
- Forced Air Heating and Cooling System
- Propane
- Electric Water Heater
Additional Features
- Patio
- Partially Fenced Property
Community Details
- Association fees include internet, lawn care
- Oxbow Condo Association, Phone Number (701) 238-0182
- Low-Rise Condominium
- Oxbow Country Club & Estates Subdivision
Listing and Financial Details
- Assessor Parcel Number 78001000180020
Map
Home Values in the Area
Average Home Value in this Area
Tax History
| Year | Tax Paid | Tax Assessment Tax Assessment Total Assessment is a certain percentage of the fair market value that is determined by local assessors to be the total taxable value of land and additions on the property. | Land | Improvement |
|---|---|---|---|---|
| 2024 | $3,795 | $170,550 | $10,750 | $159,800 |
| 2023 | $3,505 | $162,400 | $10,750 | $151,650 |
| 2022 | $3,563 | $152,300 | $10,750 | $141,550 |
| 2021 | $2,646 | $142,950 | $10,750 | $132,200 |
| 2020 | $2,369 | $122,900 | $10,750 | $112,150 |
| 2019 | $2,329 | $122,900 | $10,750 | $112,150 |
| 2018 | $2,349 | $121,700 | $10,750 | $110,950 |
| 2017 | $2,809 | $120,750 | $10,750 | $110,000 |
| 2016 | $2,330 | $100,500 | $6,450 | $94,050 |
| 2015 | $1,674 | $71,800 | $4,600 | $67,200 |
| 2014 | $1,475 | $68,400 | $4,400 | $64,000 |
| 2013 | $1,437 | $64,550 | $4,150 | $60,400 |
Property History
| Date | Event | Price | List to Sale | Price per Sq Ft |
|---|---|---|---|---|
| 10/17/2025 10/17/25 | Price Changed | $460,000 | -3.2% | $162 / Sq Ft |
| 09/11/2025 09/11/25 | For Sale | $475,000 | -- | $167 / Sq Ft |
Purchase History
| Date | Type | Sale Price | Title Company |
|---|---|---|---|
| Warranty Deed | $252,000 | The Title Co Residential | |
| Warranty Deed | -- | -- | |
| Warranty Deed | -- | -- | |
| Condominium Deed | -- | -- |
Mortgage History
| Date | Status | Loan Amount | Loan Type |
|---|---|---|---|
| Open | $269,155 | New Conventional | |
| Previous Owner | $135,000 | New Conventional |
Source: NorthstarMLS
MLS Number: 6785619
APN: 78-0010-00180-020
Disclaimer: Certain information contained herein is derived from information provided by parties other than Homes.com. All information provided is deemed reliable, but is not guaranteed to be accurate and should be independently verified.
![]() Based on information submitted to the MLS GRID. All data is obtained from various sources and may not have been verified by broker or MLS GRID. Supplied Open House Information is subject to change without notice. All information should be independently reviewed and verified for accuracy. Properties may or may not be listed by the office/agent presenting the information. Some IDX listings have been excluded from this website.
Based on information submitted to the MLS GRID. All data is obtained from various sources and may not have been verified by broker or MLS GRID. Supplied Open House Information is subject to change without notice. All information should be independently reviewed and verified for accuracy. Properties may or may not be listed by the office/agent presenting the information. Some IDX listings have been excluded from this website.
The Digital Millennium Copyright Act of 1998, 17 U.S.C. § 512 (the “DMCA”) provides recourse for copyright owners who believe that material appearing on the Internet infringes their rights under U.S. copyright law. If you believe in good faith that any content or material made available in connection with our website or services infringes your copyright, you (or your agent) may send us a notice requesting that the content or material be removed, or access to it blocked.
Notices must be sent in writing by email to DMCAnotice@MLSGrid.com.
The DMCA requires that your notice of alleged copyright infringement include the following information:
(1) description of the copyrighted work that is the subject of claimed infringement;
(2) description of the alleged infringing content and information sufficient to permit us to locate the content;
(3) contact information for you, including your address, telephone number and email address;
(4) a statement by you that you have a good faith belief that the content in the manner complained of is not authorized by the copyright owner, or its agent, or by the operation of any law;
(5) a statement by you, signed under penalty of perjury, that the information in the notification is accurate and that you have the authority to enforce the copyrights that are claimed to be infringed; and
(6) a physical or electronic signature of the copyright owner or a person authorized to act on the copyright owner’s behalf. Failure to include all of the above information may result in the delay of the processing of your complaint.
- 510 Sunset Dr
- 316 Trent Jones Dr
- TBD S Schnell Dr
- 1742 160th Ave S
- 8239 Hebgen Dr
- 8233 Hebgen Dr
- 1702 110th St
- 1758 108th Ave S
- 1311 Cossette Dr S
- 1075 Saltwater Way Bypass
- 1025 Saltwater Way
- 9350 and 9124 57th
- 10358 Burgundy Dr
- 10350 Burgundy Dr
- Valhalla Plan at Maple Lake Estates
- Maggie Plan at Maple Lake Estates
- Cascade Plan at Maple Lake Estates
- Rosewood Plan at Maple Lake Estates
- 10342 Burgundy Dr
- Providence Plan at Maple Lake Estates
- 6675 33rd St S
- 1867-1891 63rd Ave S Unit 1883
- 7994 Jacks Way
- 5805 14th St S
- 526 1st St Unit 1
- 526 1st St Unit 2
- 6718 68th St S
- 5450 26th St S
- 5800 S 38th St
- 5624 Tillstone Dr S
- 4000 58th Ave S
- 5522 36th St S
- 5676 38th St S
- 2651 Whispering Creek Cir S
- 5301 27th St S
- 6733 67th Ave S
- 6715 66th Ave S
- 6747 66th Ave S
- 6751 66th Ave S
- 4720-4750 Timber Creek Pkwy S
