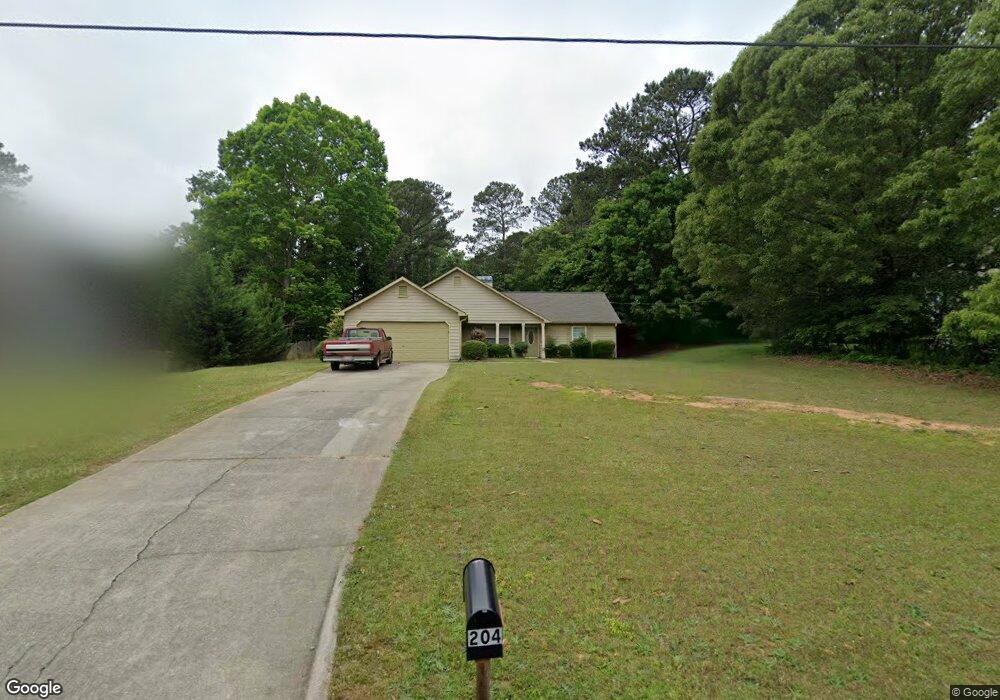
204 Pineknoll Ct Ellenwood, GA 30294
Estimated Value: $236,982 - $279,000
3
Beds
2
Baths
1,702
Sq Ft
$151/Sq Ft
Est. Value
About This Home
This home is located at 204 Pineknoll Ct, Ellenwood, GA 30294 and is currently estimated at $257,746, approximately $151 per square foot. 204 Pineknoll Ct is a home located in Henry County with nearby schools including Austin Road Elementary School, Austin Road Middle School, and Woodland High School.
Ownership History
Date
Name
Owned For
Owner Type
Purchase Details
Closed on
Feb 26, 2018
Sold by
Rosa Eddie
Bought by
Cerberus Sfr Holdings Lp
Current Estimated Value
Purchase Details
Closed on
Jul 26, 2013
Sold by
Mars And Associates Svcs I
Bought by
Rosa Eddie and Ayalarosa Norma I
Purchase Details
Closed on
Jun 18, 2001
Sold by
Hud
Bought by
Rosa Eddie
Home Financials for this Owner
Home Financials are based on the most recent Mortgage that was taken out on this home.
Original Mortgage
$96,425
Interest Rate
7.14%
Mortgage Type
New Conventional
Purchase Details
Closed on
Feb 1, 2000
Sold by
Fleet Mtg Corp
Bought by
Hud
Purchase Details
Closed on
Apr 30, 1993
Sold by
Main Street Homes
Bought by
Fincher Don A and Finchesr Tangie D
Home Financials for this Owner
Home Financials are based on the most recent Mortgage that was taken out on this home.
Original Mortgage
$78,650
Interest Rate
7.53%
Mortgage Type
FHA
Create a Home Valuation Report for This Property
The Home Valuation Report is an in-depth analysis detailing your home's value as well as a comparison with similar homes in the area
Home Values in the Area
Average Home Value in this Area
Purchase History
| Date | Buyer | Sale Price | Title Company |
|---|---|---|---|
| Cerberus Sfr Holdings Lp | $122,500 | -- | |
| Rosa Eddie | -- | -- | |
| Rosa Eddie | -- | -- | |
| Hud | -- | -- | |
| Fleet Mtg Corp | $816,790 | -- | |
| Fincher Don A | $79,900 | -- |
Source: Public Records
Mortgage History
| Date | Status | Borrower | Loan Amount |
|---|---|---|---|
| Previous Owner | Rosa Eddie | $96,425 | |
| Previous Owner | Fincher Don A | $78,650 |
Source: Public Records
Tax History Compared to Growth
Tax History
| Year | Tax Paid | Tax Assessment Tax Assessment Total Assessment is a certain percentage of the fair market value that is determined by local assessors to be the total taxable value of land and additions on the property. | Land | Improvement |
|---|---|---|---|---|
| 2025 | $3,931 | $98,440 | $14,000 | $84,440 |
| 2024 | $3,931 | $92,840 | $14,000 | $78,840 |
| 2023 | $3,557 | $91,680 | $12,000 | $79,680 |
| 2022 | $3,044 | $78,320 | $10,000 | $68,320 |
| 2021 | $2,312 | $59,240 | $10,000 | $49,240 |
| 2020 | $1,927 | $49,200 | $6,000 | $43,200 |
| 2019 | $1,906 | $48,640 | $6,000 | $42,640 |
| 2018 | $1,734 | $44,160 | $6,000 | $38,160 |
| 2016 | $1,387 | $35,120 | $6,000 | $29,120 |
| 2015 | -- | $28,040 | $6,000 | $22,040 |
| 2014 | $904 | $21,600 | $4,000 | $17,600 |
Source: Public Records
Map
Nearby Homes
- 565 Scarborough Rd
- 168 Chapel Ridge Dr
- 160 Chapel Ridge Dr
- 500 Saint Sambar Dr
- 444 Cauthen Ct
- 0 Kingsbrook Dr Unit 19 LOTS 10399843
- 429 Saint Surrey Way
- 1414 Panola Rd
- 963 Blackberry Ct
- 907 Strawberry Ct
- 107 S Circle Dr
- 270 Huckleberry Ln
- 103 N Circle Dr
- 4923 Amsler Rd
- 116 Kalsum Trail
- 4241 Hearn Rd
- 115 Elizabeth Way
- 176 Fairoaks Cir
- 5520 Hearn Rd
- 5478 Flakes Mill Rd
- 208 Pineknoll Ct
- 0 Pineknoll Ct Unit 8269504
- 200 Pineknoll Ct
- 568 Scarborough Rd
- 100 Whirlaway Dr Unit 4
- 564 Scarborough Rd
- 564 Scarborough Rd Unit 4
- 201 Pineknoll Ct
- 212 Pineknoll Ct
- 205 Pineknoll Ct Unit IV
- 116 Whirlaway Dr
- 116 Whirlaway Dr
- 116 Whirlaway Dr Unit IV
- 560 Scarborough Rd Unit 4
- 209 Pineknoll Ct
- 99 Whirlaway Dr Unit 4
- 105 Whirlaway Dr
- 216 Pineknoll Ct Unit IV
- 118 Whirlaway Dr
- 95 Whirlaway Dr