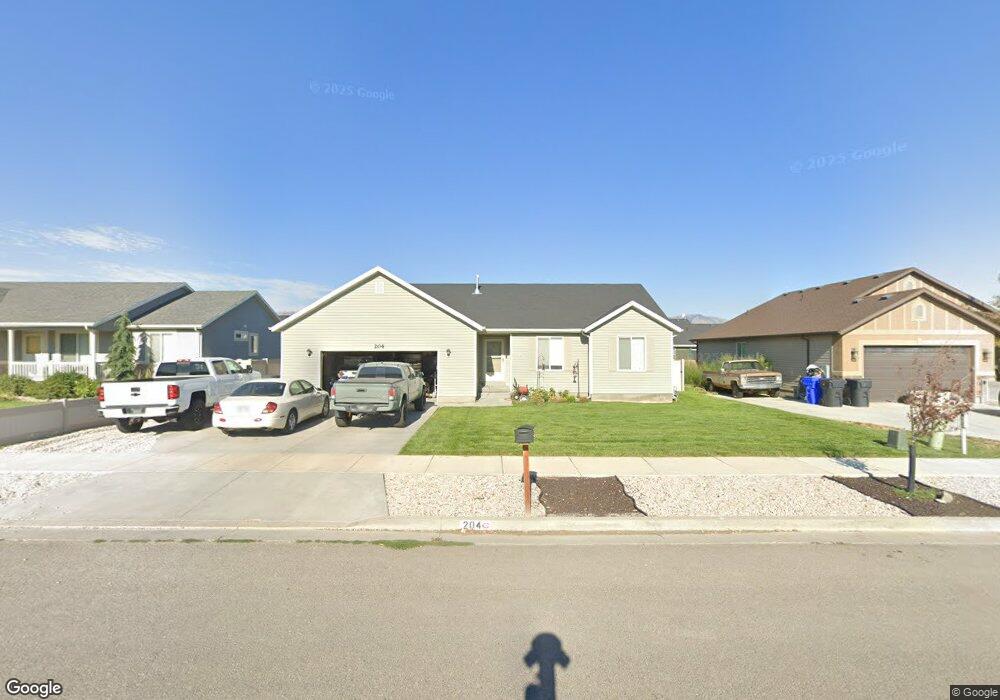
204 Ranch Rd Grantsville, UT 84029
Estimated Value: $484,184 - $561,000
4
Beds
2
Baths
2,814
Sq Ft
$181/Sq Ft
Est. Value
About This Home
This home is located at 204 Ranch Rd, Grantsville, UT 84029 and is currently estimated at $508,546, approximately $180 per square foot. 204 Ranch Rd is a home located in Tooele County with nearby schools including Twenty Wells Elementary, Grantsville Junior High School, and Grantsville High School.
Ownership History
Date
Name
Owned For
Owner Type
Purchase Details
Closed on
May 6, 2021
Sold by
Miner Douglas K
Bought by
Miner Douglas K and Miner Heidi M
Current Estimated Value
Purchase Details
Closed on
Jun 25, 2015
Sold by
Mountian Vista Development Inc
Bought by
Miner Douglas K
Home Financials for this Owner
Home Financials are based on the most recent Mortgage that was taken out on this home.
Original Mortgage
$228,396
Outstanding Balance
$177,277
Interest Rate
3.81%
Mortgage Type
VA
Estimated Equity
$331,269
Purchase Details
Closed on
Sep 18, 2014
Sold by
Rindlesbach Ken R and Rindlesbach Pension Ken R
Bought by
Mountain Vista Development Inc
Home Financials for this Owner
Home Financials are based on the most recent Mortgage that was taken out on this home.
Original Mortgage
$162,200
Interest Rate
3.76%
Mortgage Type
Construction
Create a Home Valuation Report for This Property
The Home Valuation Report is an in-depth analysis detailing your home's value as well as a comparison with similar homes in the area
Home Values in the Area
Average Home Value in this Area
Purchase History
| Date | Buyer | Sale Price | Title Company |
|---|---|---|---|
| Miner Douglas K | -- | First American Union Park | |
| Miner Douglas K | -- | Sutherland Title Company | |
| Mountain Vista Development Inc | -- | Sutherland Title Company |
Source: Public Records
Mortgage History
| Date | Status | Borrower | Loan Amount |
|---|---|---|---|
| Open | Miner Douglas K | $228,396 | |
| Previous Owner | Mountain Vista Development Inc | $162,200 |
Source: Public Records
Tax History Compared to Growth
Tax History
| Year | Tax Paid | Tax Assessment Tax Assessment Total Assessment is a certain percentage of the fair market value that is determined by local assessors to be the total taxable value of land and additions on the property. | Land | Improvement |
|---|---|---|---|---|
| 2025 | $2,733 | $235,845 | $38,280 | $197,565 |
| 2024 | $2,733 | $223,119 | $38,280 | $184,839 |
| 2023 | $2,733 | $239,058 | $48,675 | $190,383 |
| 2022 | $3,005 | $276,544 | $60,995 | $215,549 |
| 2021 | $2,284 | $171,429 | $48,579 | $122,850 |
| 2020 | $2,280 | $301,262 | $88,325 | $212,937 |
| 2019 | $2,214 | $285,769 | $30,000 | $255,769 |
| 2018 | $2,159 | $262,517 | $30,000 | $232,517 |
| 2017 | $1,872 | $241,379 | $30,000 | $211,379 |
| 2016 | $434 | $122,190 | $16,500 | $105,690 |
| 2015 | $434 | $30,000 | $0 | $0 |
Source: Public Records
Map
Nearby Homes
- 416 E Spruce Ln Unit 113
- 368 E Stafford St Unit 127
- 382 E Stafford St Unit 126
- 113 Utah 112
- 697 E Main St
- 72 S Mustang Ridge Rd Unit 109
- 699 E Main St
- 799 E Main St
- 178 S Liberty Landing Unit 206
- 144 S Liberty Landing Unit 203
- 130 S Liberty Landing Unit 202
- 122 S Liberty Landing Unit 201
- 637 E Main St
- 393 Roadster Ln
- 145 S Liberty Landing Unit 223
- 131 S Liberty Landing Unit 224
- 123 S Liberty Landing Unit 225
- 653 E Main St Unit 45
- 653 E Main St Unit 16
- 428 S Saddle Rd
- 198 Ranch Rd
- 210 Ranch Rd
- 210 S Ranch Rd
- 322 S Ranch Rd Unit 202
- 370 S Ranch Rd Unit 104
- 209 S Tawny Dr
- 203 S Tawny Dr
- 190 Ranch Rd
- 216 S Ranch Rd
- 216 Ranch Rd
- 702 E Cherry St
- 193 S Tawny Dr Unit 302
- 193 S Tawny Dr
- 223 S Tawny Dr
- 184 Ranch Rd
- 224 Ranch Rd
- 195 Ranch Rd
- 215 Ranch Rd
- 706 E Cherry St
- 185 S Tawny Dr