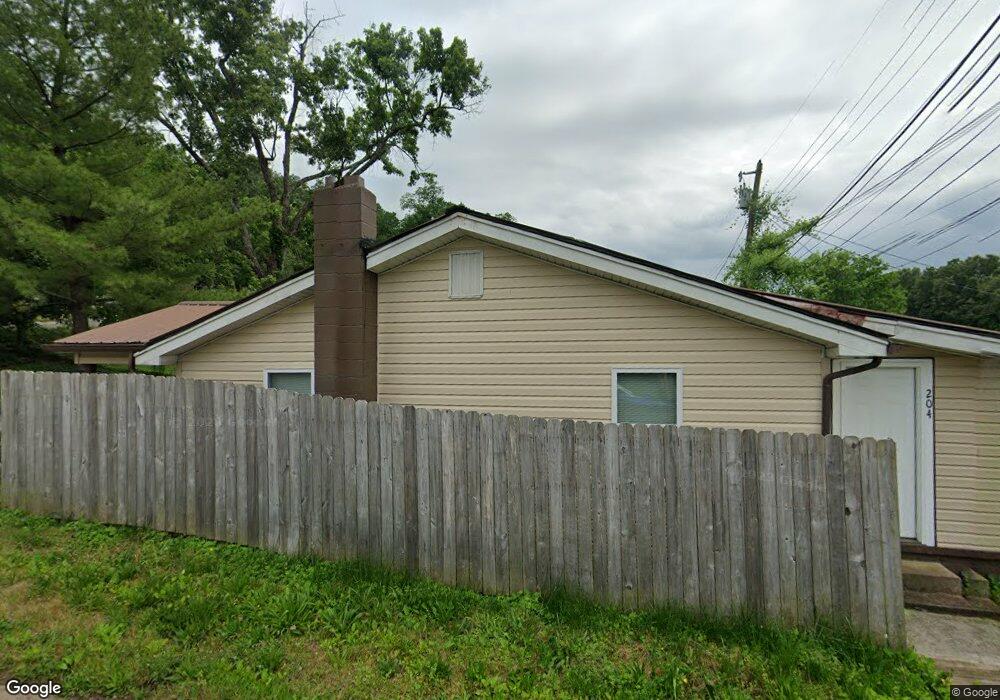
204 Ross St Rossville, GA 30741
Estimated Value: $139,000 - $161,000
2
Beds
1
Bath
899
Sq Ft
$164/Sq Ft
Est. Value
About This Home
This home is located at 204 Ross St, Rossville, GA 30741 and is currently estimated at $147,398, approximately $163 per square foot. 204 Ross St is a home located in Walker County with nearby schools including Rossville Elementary School, Rossville Middle School, and Ridgeland High School.
Ownership History
Date
Name
Owned For
Owner Type
Purchase Details
Closed on
Mar 11, 2025
Sold by
Bjr Manager Llc
Bought by
Lrr Manager Llc
Current Estimated Value
Purchase Details
Closed on
Feb 21, 2025
Sold by
Ruth John
Bought by
Bjr Manager Llc
Purchase Details
Closed on
Dec 14, 2018
Sold by
Nationstar Mtg Llc
Bought by
Howard Ruth John
Purchase Details
Closed on
Nov 6, 2018
Sold by
Stewart Greggory A
Bought by
Nationstar Mtg Llc
Purchase Details
Closed on
Apr 9, 2008
Sold by
Guinn Patricia D
Bought by
Stewart Greggory A
Purchase Details
Closed on
Sep 20, 2002
Sold by
Byer Suzanne Jordan
Bought by
Guinn Stanley A and Guinn Patricia D
Purchase Details
Closed on
Sep 16, 1993
Sold by
Virgil W Chambers
Bought by
Byer Suzanne Jordan
Purchase Details
Closed on
Oct 21, 1987
Sold by
Miller Lucien W and Miller Gudrun G
Bought by
Virgil W Chambers
Purchase Details
Closed on
Nov 21, 1978
Sold by
Chambers Charley
Bought by
Miller Lucien W and Miller Gudrun G
Purchase Details
Closed on
Jan 1, 1972
Bought by
Chambers Charley
Create a Home Valuation Report for This Property
The Home Valuation Report is an in-depth analysis detailing your home's value as well as a comparison with similar homes in the area
Home Values in the Area
Average Home Value in this Area
Purchase History
| Date | Buyer | Sale Price | Title Company |
|---|---|---|---|
| Lrr Manager Llc | -- | -- | |
| Bjr Manager Llc | -- | -- | |
| Howard Ruth John | $19,025 | -- | |
| Nationstar Mtg Llc | $24,024 | -- | |
| Stewart Greggory A | $64,500 | -- | |
| Guinn Stanley A | $13,500 | -- | |
| Byer Suzanne Jordan | $14,900 | -- | |
| Virgil W Chambers | -- | -- | |
| Miller Lucien W | $8,000 | -- | |
| Chambers Charley | -- | -- |
Source: Public Records
Tax History Compared to Growth
Tax History
| Year | Tax Paid | Tax Assessment Tax Assessment Total Assessment is a certain percentage of the fair market value that is determined by local assessors to be the total taxable value of land and additions on the property. | Land | Improvement |
|---|---|---|---|---|
| 2024 | $942 | $40,200 | $1,560 | $38,640 |
| 2023 | $917 | $38,185 | $1,560 | $36,625 |
| 2022 | $858 | $33,052 | $1,560 | $31,492 |
| 2021 | $639 | $21,349 | $1,560 | $19,789 |
| 2020 | $563 | $17,733 | $1,560 | $16,173 |
| 2019 | $297 | $12,413 | $1,560 | $10,853 |
| 2018 | $345 | $13,037 | $2,184 | $10,853 |
| 2017 | $428 | $13,037 | $2,184 | $10,853 |
| 2016 | $400 | $13,037 | $2,184 | $10,853 |
| 2015 | $468 | $14,961 | $2,612 | $12,349 |
| 2014 | $406 | $15,500 | $2,612 | $12,888 |
| 2013 | -- | $15,499 | $2,612 | $12,887 |
Source: Public Records
Map
Nearby Homes
- 136 Summit St
- Lot 81 Battle Bluff Dr
- Lot 80 Battle Bluff Dr
- Lot 79 Battle Bluff Dr
- 405 Miami Ave
- 1204 Wooden Ave
- 4 Carroll Ln
- 105 Elm St
- 164 S Mission Ridge Dr
- 806 Mcfarland Ave
- 328 S Mission Ridge Dr
- 916 Logan Ave
- 189 Leinbach Rd
- 200 W Oak St
- 1014 Lee Ave
- 126 S Liner St
- 515 Hogan Rd
- 115 Beech St
- 816 Indian Ave
- 141 Hogan Rd