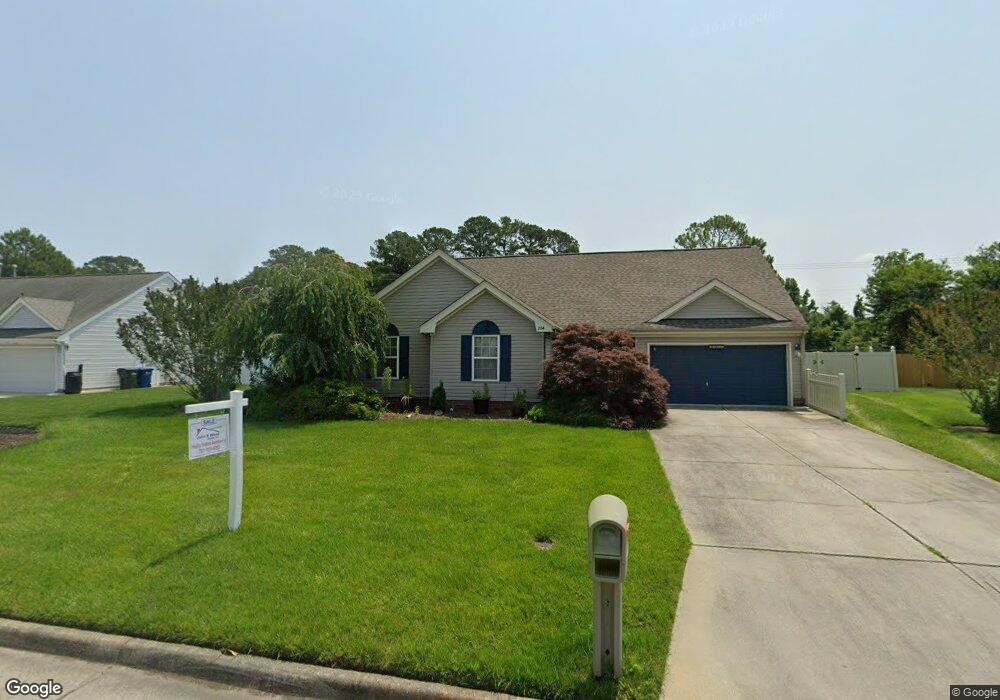
204 Round Table Arch Suffolk, VA 23435
Cyprus NeighborhoodEstimated Value: $428,147 - $448,000
4
Beds
3
Baths
2,300
Sq Ft
$190/Sq Ft
Est. Value
About This Home
This home is located at 204 Round Table Arch, Suffolk, VA 23435 and is currently estimated at $436,787, approximately $189 per square foot. 204 Round Table Arch is a home located in Suffolk City with nearby schools including Driver Elementary School, John Yeates Middle School, and Nansemond River High School.
Ownership History
Date
Name
Owned For
Owner Type
Purchase Details
Closed on
Jun 22, 2023
Sold by
Sherry L Gibbs Revocable Trust and Gibbs Sherry L
Bought by
Root James Elliott and Root Marita Pierson
Current Estimated Value
Home Financials for this Owner
Home Financials are based on the most recent Mortgage that was taken out on this home.
Original Mortgage
$215,000
Outstanding Balance
$208,767
Interest Rate
6.57%
Mortgage Type
VA
Estimated Equity
$228,020
Purchase Details
Closed on
Dec 8, 2021
Sold by
Gibbs Sherry L
Bought by
Gibbs Sherry L and The Sherry L Gibbs Revocable T
Purchase Details
Closed on
Nov 9, 2018
Sold by
Gibbs Sherry L
Bought by
Gibbs Charles R and Gibbs Sherry L
Home Financials for this Owner
Home Financials are based on the most recent Mortgage that was taken out on this home.
Original Mortgage
$177,500
Interest Rate
4.9%
Mortgage Type
New Conventional
Create a Home Valuation Report for This Property
The Home Valuation Report is an in-depth analysis detailing your home's value as well as a comparison with similar homes in the area
Home Values in the Area
Average Home Value in this Area
Purchase History
| Date | Buyer | Sale Price | Title Company |
|---|---|---|---|
| Root James Elliott | $405,000 | Fidelity National Title | |
| Gibbs Sherry L | -- | None Available | |
| Gibbs Charles R | -- | None Available |
Source: Public Records
Mortgage History
| Date | Status | Borrower | Loan Amount |
|---|---|---|---|
| Open | Root James Elliott | $215,000 | |
| Previous Owner | Gibbs Charles R | $177,500 |
Source: Public Records
Tax History
| Year | Tax Paid | Tax Assessment Tax Assessment Total Assessment is a certain percentage of the fair market value that is determined by local assessors to be the total taxable value of land and additions on the property. | Land | Improvement |
|---|---|---|---|---|
| 2025 | $2,609 | $403,500 | $85,000 | $318,500 |
| 2024 | $4,767 | $376,900 | $85,000 | $291,900 |
| 2023 | $4,426 | $371,600 | $85,000 | $286,600 |
| 2022 | $3,769 | $345,800 | $85,000 | $260,800 |
| 2021 | $3,331 | $300,100 | $73,600 | $226,500 |
| 2020 | $3,048 | $274,600 | $73,600 | $201,000 |
| 2019 | $3,091 | $278,500 | $73,600 | $204,900 |
| 2018 | $3,040 | $278,700 | $73,600 | $205,100 |
| 2017 | $2,755 | $257,500 | $73,600 | $183,900 |
| 2016 | $2,755 | $257,500 | $73,600 | $183,900 |
| 2015 | $1,392 | $253,800 | $73,600 | $180,200 |
| 2014 | $1,392 | $253,800 | $73,600 | $180,200 |
Source: Public Records
Map
Nearby Homes
- 202 Baron Blvd
- 221 Baron Blvd
- 4798 Afton Ct
- 5232 Corolla Dr
- 5134 Duxbury Rd
- 5224 Corolla Dr
- 5132 Duxbury Rd
- 5133 Duxbury Rd
- 5220 Corolla Dr
- 5219 Lombard St
- 5133 Lombard St
- 5218 Corolla Dr
- 5112 Annapolis Dr
- 5127 Duxbury Rd
- 5121 Duxbury Rd
- 5110 Annapolis Dr
- 5124 Mission St
- 5214 Corolla Dr
- 5104 Annapolis Dr
- 5104 Lombard St
- 202 Round Table Arch
- 206 Round Table Arch
- 205 Round Table Arch
- 200 Round Table Arch
- 208 Round Table Arch
- 203 Round Table Arch
- 201 Round Table Arch
- 4272 Shoulders Hill Rd
- 312 Page Place
- 314 Page Place
- 310 Page Place
- 102 Count Crescent
- 316 Page Place
- 308 Page Place
- 101 Count Crescent
- 318 Page Place
- 103 Count Crescent
- 4328 Shoulders Hill Rd
- 104 Count Crescent
- 306 Page Place
Your Personal Tour Guide
Ask me questions while you tour the home.