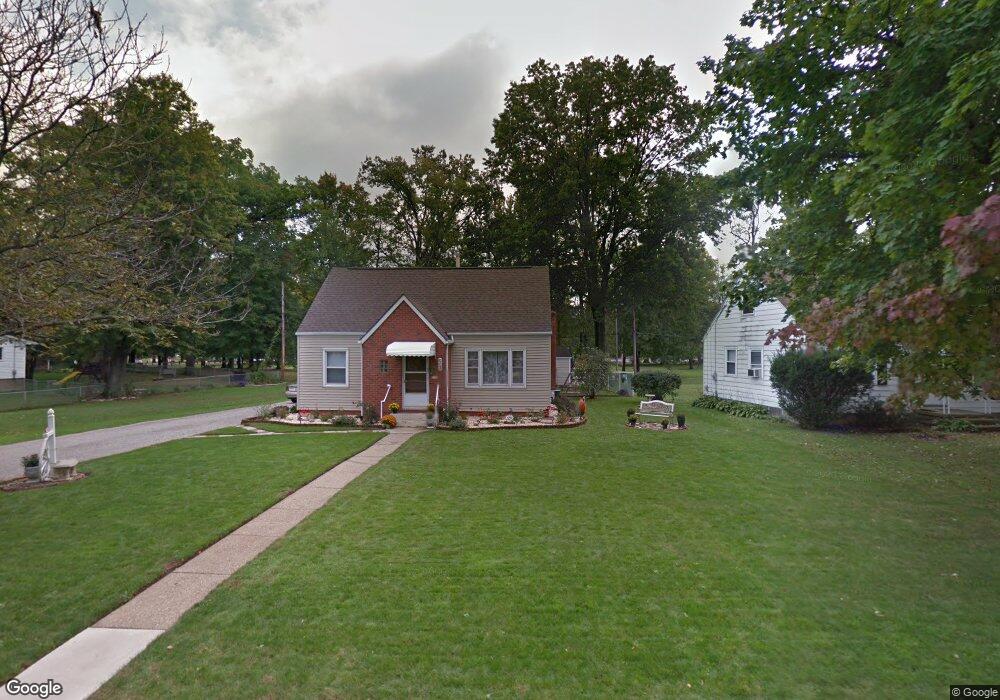
204 Rowmont Ave SW Massillon, OH 44646
Estimated Value: $160,000 - $192,000
4
Beds
2
Baths
1,672
Sq Ft
$105/Sq Ft
Est. Value
About This Home
This home is located at 204 Rowmont Ave SW, Massillon, OH 44646 and is currently estimated at $175,826, approximately $105 per square foot. 204 Rowmont Ave SW is a home located in Stark County with nearby schools including Edison Middle School, Pfeiffer Intermediate School, and Perry High School.
Ownership History
Date
Name
Owned For
Owner Type
Purchase Details
Closed on
Nov 12, 2024
Sold by
Draime James D and Draime Jan T
Bought by
Draime James D
Current Estimated Value
Purchase Details
Closed on
May 28, 2002
Sold by
Sanders Ed J and Sanders Alice J
Bought by
Draime James D and Draime Jan T
Home Financials for this Owner
Home Financials are based on the most recent Mortgage that was taken out on this home.
Original Mortgage
$88,000
Interest Rate
7.07%
Mortgage Type
Purchase Money Mortgage
Purchase Details
Closed on
Aug 17, 1994
Sold by
Little Gary M
Bought by
Sanders Ed J and Sanders Alice
Home Financials for this Owner
Home Financials are based on the most recent Mortgage that was taken out on this home.
Original Mortgage
$675,000
Interest Rate
8.73%
Mortgage Type
New Conventional
Purchase Details
Closed on
May 3, 1989
Purchase Details
Closed on
Jul 29, 1988
Create a Home Valuation Report for This Property
The Home Valuation Report is an in-depth analysis detailing your home's value as well as a comparison with similar homes in the area
Home Values in the Area
Average Home Value in this Area
Purchase History
| Date | Buyer | Sale Price | Title Company |
|---|---|---|---|
| Draime James D | -- | Stewart Title | |
| Draime James D | $95,000 | -- | |
| Sanders Ed J | $75,000 | -- | |
| -- | $55,000 | -- | |
| -- | $49,500 | -- |
Source: Public Records
Mortgage History
| Date | Status | Borrower | Loan Amount |
|---|---|---|---|
| Previous Owner | Draime James D | $88,000 | |
| Previous Owner | Sanders Ed J | $675,000 |
Source: Public Records
Tax History Compared to Growth
Tax History
| Year | Tax Paid | Tax Assessment Tax Assessment Total Assessment is a certain percentage of the fair market value that is determined by local assessors to be the total taxable value of land and additions on the property. | Land | Improvement |
|---|---|---|---|---|
| 2025 | -- | $50,340 | $10,540 | $39,800 |
| 2024 | -- | $50,340 | $10,540 | $39,800 |
| 2023 | $2,100 | $41,870 | $9,280 | $32,590 |
| 2022 | $1,056 | $41,870 | $9,280 | $32,590 |
| 2021 | $2,249 | $41,870 | $9,280 | $32,590 |
| 2020 | $1,984 | $35,430 | $7,810 | $27,620 |
| 2019 | $1,790 | $31,750 | $7,810 | $23,940 |
| 2018 | $1,585 | $31,750 | $7,810 | $23,940 |
| 2017 | $1,615 | $29,970 | $8,050 | $21,920 |
| 2016 | $1,624 | $29,970 | $8,050 | $21,920 |
| 2015 | $1,638 | $29,970 | $8,050 | $21,920 |
| 2014 | $1,640 | $29,550 | $7,910 | $21,640 |
| 2013 | $782 | $29,550 | $7,910 | $21,640 |
Source: Public Records
Map
Nearby Homes
- 232 Proudley Ave SW
- 0 Newport Ave NW Unit 5143464
- 212 Lennox Ave NW
- 226 Austin Ave NW
- 141 Ingall Ave NW
- 420 Snively Ave NW
- 3412 Bailey St NW
- 174 26th St SE
- 302 Jackson Ave NW
- 138 Wrexham Ave SW
- 2950 Southway St SW
- 0 Clark St SW Unit 5126336
- 3103 Wattova Rd NW
- 518 Jackson Ave NW
- 3626 Hazelbrook St SW
- 337 Harding Ave NW
- 804 Jeffrey Ave NW
- 326 Locke Ave NW
- 334 Locke Ave NW
- 2312 Massachusetts Ave SE
- 210 Rowmont Ave SW
- 218 Rowmont Ave SW
- 180 Rowmont Ave SW
- 180 Rowmont Rd SW
- 224 Rowmont Ave SW
- 205 Rowmont Ave SW
- 211 Rowmont Ave SW
- 217 Rowmont Ave SW
- 3198 Rowmont Ave SW
- 187 Rowmont Ave SW
- 172 Rowmont Ave SW
- 3219 Lynch St SW
- 3194 Rowmont Ave SW
- 3197 Wildwood Cir SW
- 3182 Wildwood Cir SW
- 3194 Rowmont Rd SW
- 166 Rowmont Ave SW
- 166 Rowmont Rd SW
- 179 Rowmont Ave SW
- 3213 Lynch St SW