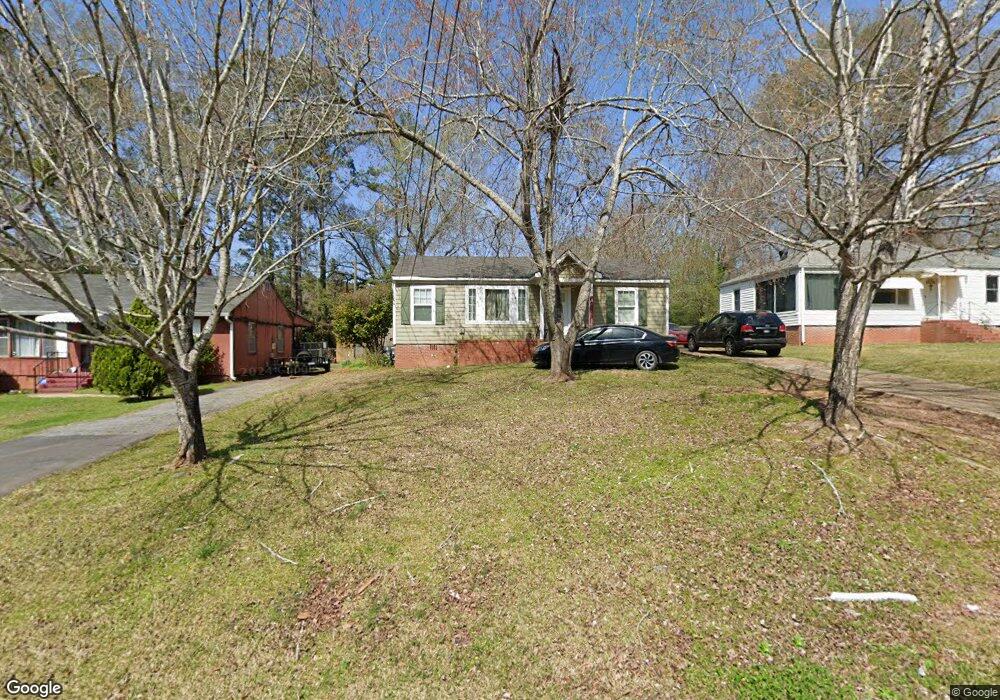
204 Rutland Cir Lagrange, GA 30241
Estimated Value: $164,000 - $175,000
3
Beds
1
Bath
1,320
Sq Ft
$128/Sq Ft
Est. Value
About This Home
This home is located at 204 Rutland Cir, Lagrange, GA 30241 and is currently estimated at $169,579, approximately $128 per square foot. 204 Rutland Cir is a home located in Troup County with nearby schools including Franklin Forest Elementary School, Hollis Hand Elementary School, and Ethel W. Kight Elementary School.
Ownership History
Date
Name
Owned For
Owner Type
Purchase Details
Closed on
Dec 6, 2022
Sold by
Henderson Richard L
Bought by
Hutchinson Investments Llc
Current Estimated Value
Purchase Details
Closed on
Feb 28, 2020
Sold by
Hurt Marsha
Bought by
Henderson Richard L
Home Financials for this Owner
Home Financials are based on the most recent Mortgage that was taken out on this home.
Original Mortgage
$88,074
Interest Rate
3.37%
Mortgage Type
FHA
Purchase Details
Closed on
Jan 26, 2007
Sold by
Williamson Christopher
Bought by
Hunt Marsha
Home Financials for this Owner
Home Financials are based on the most recent Mortgage that was taken out on this home.
Original Mortgage
$66,000
Interest Rate
6.14%
Mortgage Type
New Conventional
Purchase Details
Closed on
Jul 27, 1998
Sold by
Jerry Wyne Eason For William C
Bought by
Williamson Christopher
Purchase Details
Closed on
Mar 26, 1979
Sold by
Eason William C
Bought by
Jerry Wyne Eason For William C
Purchase Details
Closed on
Mar 7, 1962
Sold by
Jackson Robert P
Bought by
Eason William C
Create a Home Valuation Report for This Property
The Home Valuation Report is an in-depth analysis detailing your home's value as well as a comparison with similar homes in the area
Home Values in the Area
Average Home Value in this Area
Purchase History
| Date | Buyer | Sale Price | Title Company |
|---|---|---|---|
| Hutchinson Investments Llc | $90,200 | -- | |
| Henderson Richard L | $89,700 | -- | |
| Hunt Marsha | $35,127 | -- | |
| Williamson Christopher | $41,500 | -- | |
| Jerry Wyne Eason For William C | $25,000 | -- | |
| Eason William C | -- | -- |
Source: Public Records
Mortgage History
| Date | Status | Borrower | Loan Amount |
|---|---|---|---|
| Previous Owner | Henderson Richard L | $88,074 | |
| Previous Owner | Hunt Marsha | $66,000 |
Source: Public Records
Tax History Compared to Growth
Tax History
| Year | Tax Paid | Tax Assessment Tax Assessment Total Assessment is a certain percentage of the fair market value that is determined by local assessors to be the total taxable value of land and additions on the property. | Land | Improvement |
|---|---|---|---|---|
| 2024 | $1,349 | $49,460 | $8,000 | $41,460 |
| 2023 | $984 | $43,312 | $6,360 | $36,952 |
| 2022 | $1,111 | $39,792 | $6,360 | $33,432 |
| 2021 | $1,029 | $34,116 | $6,360 | $27,756 |
| 2020 | $1,029 | $34,116 | $6,360 | $27,756 |
| 2019 | $771 | $25,568 | $5,720 | $19,848 |
| 2018 | $771 | $25,572 | $5,724 | $19,848 |
| 2017 | $771 | $25,572 | $5,724 | $19,848 |
| 2016 | $750 | $24,884 | $5,724 | $19,160 |
| 2015 | $752 | $24,884 | $5,724 | $19,160 |
| 2014 | $722 | $23,875 | $5,724 | $18,151 |
| 2013 | -- | $24,924 | $5,724 | $19,200 |
Source: Public Records
Map
Nearby Homes
- 210 Hearthstone Dr
- 130 Clara Jean Ct
- 121 Ct
- 618 S Harlem Cir
- 616 S Harlem Cir
- 5 Curran Ave
- 305 Lenox Cir
- 226 Lenox Cir
- 706 N Harlem Cir
- 105 Lenox Cir
- 101 Lenox Cir
- 608 S Harlem Cir
- 0 N Barnard Ave
- 606 S Harlem Cir
- 600 S Harlem Cir
- 131 Foch St
- 121 de Groat St
- 906 Georgia Ave
- 902 Georgia Ave
- 109 Dogwood Dr
- 204 Rutland Cir Unit 19
- 202 Rutland Cir
- 206 Rutland Cir
- 208 Rutland Cir
- 200 Rutland Cir
- 238 Rutland Cir
- 230 Rutland Cir Unit 6
- 230 Rutland Cir
- 228 Rutland Cir
- 210 Rutland Cir
- 232 Rutland Cir
- 236 Rutland Cir
- 226 Rutland Cir
- 209 Rutland Cir
- 207 Rutland Cir
- 205 Rutland Cir
- 234 Rutland Cir
- 203 Rutland Cir
- 224 Rutland Cir
- 213 Rutland Cir