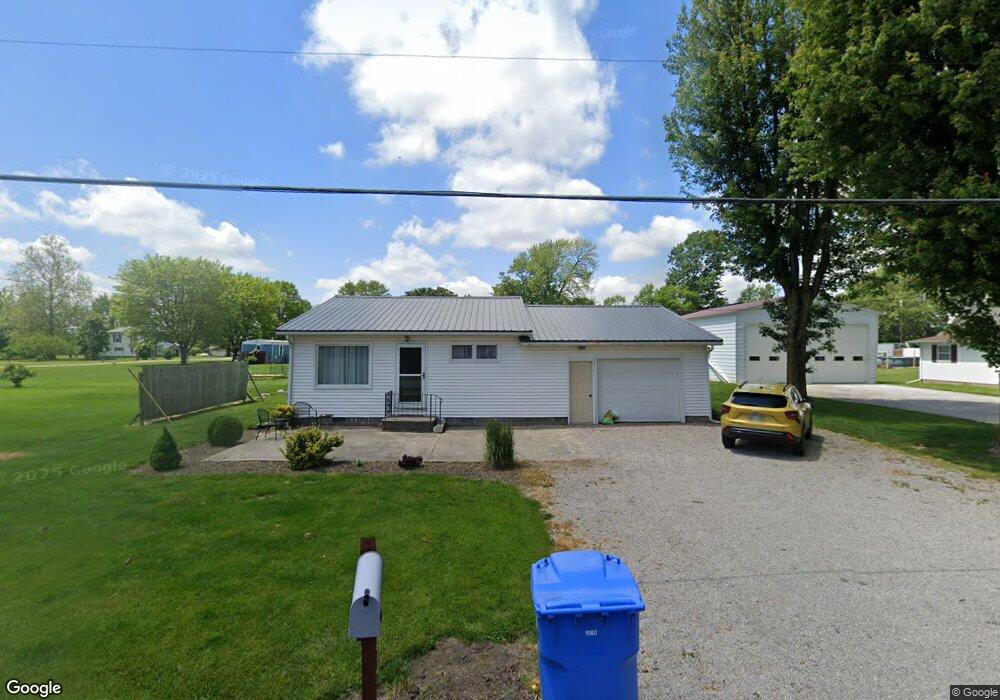
204 S Logan St Dupont, OH 45837
Estimated Value: $58,000 - $68,000
--
Bed
--
Bath
576
Sq Ft
$106/Sq Ft
Est. Value
About This Home
This home is located at 204 S Logan St, Dupont, OH 45837 and is currently estimated at $60,950, approximately $105 per square foot. 204 S Logan St is a home with nearby schools including Continental Local Elementary School and Continental Local High School.
Ownership History
Date
Name
Owned For
Owner Type
Purchase Details
Closed on
Dec 2, 2020
Sold by
Durant Development Llc
Bought by
Quiqley Alexandria
Current Estimated Value
Home Financials for this Owner
Home Financials are based on the most recent Mortgage that was taken out on this home.
Original Mortgage
$38,000
Outstanding Balance
$30,527
Interest Rate
2.8%
Mortgage Type
New Conventional
Estimated Equity
$30,423
Purchase Details
Closed on
Nov 28, 2020
Sold by
Durant Development Llc
Bought by
Quigley Alexandria
Home Financials for this Owner
Home Financials are based on the most recent Mortgage that was taken out on this home.
Original Mortgage
$38,000
Outstanding Balance
$30,527
Interest Rate
2.8%
Mortgage Type
New Conventional
Estimated Equity
$30,423
Purchase Details
Closed on
Apr 21, 2015
Sold by
Prowant William Jeffrey
Bought by
Durant Development Llc
Create a Home Valuation Report for This Property
The Home Valuation Report is an in-depth analysis detailing your home's value as well as a comparison with similar homes in the area
Home Values in the Area
Average Home Value in this Area
Purchase History
| Date | Buyer | Sale Price | Title Company |
|---|---|---|---|
| Quiqley Alexandria | $40,000 | None Available | |
| Quigley Alexandria | $8,500 | None Listed On Document | |
| Quigley Alexandria | $8,500 | None Listed On Document | |
| Durant Development Llc | -- | Attorney |
Source: Public Records
Mortgage History
| Date | Status | Borrower | Loan Amount |
|---|---|---|---|
| Open | Quiqley Alexandria | $38,000 | |
| Closed | Quigley Alexandria | $38,000 |
Source: Public Records
Tax History Compared to Growth
Tax History
| Year | Tax Paid | Tax Assessment Tax Assessment Total Assessment is a certain percentage of the fair market value that is determined by local assessors to be the total taxable value of land and additions on the property. | Land | Improvement |
|---|---|---|---|---|
| 2024 | $411 | $12,380 | $930 | $11,450 |
| 2023 | $422 | $9,160 | $690 | $8,470 |
| 2022 | $397 | $9,160 | $690 | $8,470 |
| 2021 | $398 | $9,160 | $690 | $8,470 |
| 2020 | $415 | $7,800 | $690 | $7,110 |
| 2019 | $367 | $8,470 | $690 | $7,780 |
| 2018 | $351 | $8,470 | $690 | $7,780 |
| 2017 | $288 | $8,470 | $690 | $7,780 |
| 2016 | $288 | $7,800 | $690 | $7,110 |
| 2015 | $282 | $7,800 | $690 | $7,110 |
| 2014 | $278 | $7,800 | $690 | $7,110 |
| 2013 | -- | $7,800 | $690 | $7,110 |
Source: Public Records
Map
Nearby Homes
- 23068 State Route 613
- 402 S 5th St
- 200 Ohio 613
- 204 E Sugar St
- 203 E Ash St
- 301 W Forrest St
- 23423 Township Rd E
- 406 N Main St
- 0 Road E
- 5054 Ohio 634
- 207 Superior St
- 113 Superior St
- 104 Jackson St
- 23235 Road 110
- 9150 State Route 66
- 0 Sr 115 & Rd J Unit 6128830
- 0 Sr 115 & Rd J
- E Road Unit LotWP001
- 20501 U S 224
- 106 Carnation St