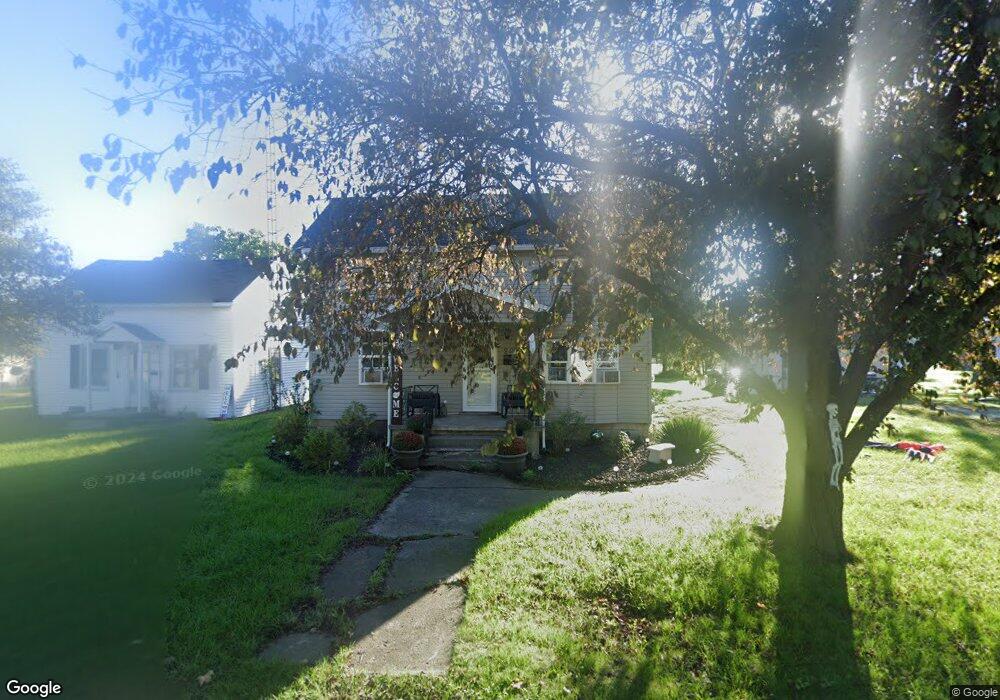
204 S Wagner Ave Wapakoneta, OH 45895
Estimated Value: $148,859 - $177,000
3
Beds
1
Bath
1,124
Sq Ft
$142/Sq Ft
Est. Value
About This Home
This home is located at 204 S Wagner Ave, Wapakoneta, OH 45895 and is currently estimated at $159,965, approximately $142 per square foot. 204 S Wagner Ave is a home located in Auglaize County with nearby schools including Wapakoneta Elementary School, Wapakoneta High School, and Wapakoneta Middle School.
Ownership History
Date
Name
Owned For
Owner Type
Purchase Details
Closed on
Sep 29, 2016
Sold by
Jackson Vincent B
Bought by
Jackson Marianne N
Current Estimated Value
Home Financials for this Owner
Home Financials are based on the most recent Mortgage that was taken out on this home.
Original Mortgage
$60,000
Outstanding Balance
$48,055
Interest Rate
3.43%
Mortgage Type
New Conventional
Estimated Equity
$111,910
Purchase Details
Closed on
May 21, 2008
Sold by
Jackson Marianne N
Bought by
Jackson Vincent B and Jackson Marianne N
Purchase Details
Closed on
Jul 20, 2006
Sold by
Hampp Darrell Edwin and Hampp Jan
Bought by
Jackson Marianne Nicole
Purchase Details
Closed on
Jun 4, 2001
Sold by
Hampp Darrell E
Bought by
Hampp Darrell E
Create a Home Valuation Report for This Property
The Home Valuation Report is an in-depth analysis detailing your home's value as well as a comparison with similar homes in the area
Home Values in the Area
Average Home Value in this Area
Purchase History
| Date | Buyer | Sale Price | Title Company |
|---|---|---|---|
| Jackson Marianne N | -- | Superior Title | |
| Jackson Vincent B | -- | Attorney | |
| Jackson Marianne Nicole | -- | None Available | |
| Hampp Darrell E | -- | -- |
Source: Public Records
Mortgage History
| Date | Status | Borrower | Loan Amount |
|---|---|---|---|
| Open | Jackson Marianne N | $60,000 |
Source: Public Records
Tax History Compared to Growth
Tax History
| Year | Tax Paid | Tax Assessment Tax Assessment Total Assessment is a certain percentage of the fair market value that is determined by local assessors to be the total taxable value of land and additions on the property. | Land | Improvement |
|---|---|---|---|---|
| 2024 | $1,839 | $37,720 | $5,740 | $31,980 |
| 2023 | $609 | $37,720 | $5,740 | $31,980 |
| 2022 | $1,080 | $30,230 | $5,160 | $25,070 |
| 2021 | $520 | $30,230 | $5,160 | $25,070 |
| 2020 | $1,064 | $30,227 | $5,156 | $25,071 |
| 2019 | $899 | $24,497 | $4,165 | $20,332 |
| 2018 | $902 | $24,497 | $4,165 | $20,332 |
| 2017 | $898 | $24,497 | $4,165 | $20,332 |
| 2016 | $746 | $20,357 | $3,945 | $16,412 |
| 2015 | $737 | $20,357 | $3,945 | $16,412 |
| 2014 | $744 | $20,357 | $3,945 | $16,412 |
| 2013 | $757 | $20,357 | $3,945 | $16,412 |
Source: Public Records
Map
Nearby Homes
- 409 S Pine St
- 0 Ohio 67
- 201 E Pearl St
- 9 E Silver St
- 211 W Benton St
- 307 W Auglaize St
- 307 W Benton St
- 102 Wapak St
- 414 W Auglaize St
- 0 Wapakoneta Cridersville Rd
- 608 W Benton St
- 420 Hoopengarner St
- 322 Cole Dr
- 814 W Benton St
- 808 Aster Dr
- 106 Valleyview Dr
- 906 Aster Dr
- 109 Bluegrass Dr
- 1100 W Auglaize St
- 204 S Wagner Ave
- 202 S Wagner Ave
- 208 S Wagner Ave
- 210 S Wagner Ave
- 203 S Wagner Ave
- 201 S Wagner Ave
- 123 N Wagner Ave
- 207 S Wagner Ave
- 123 S Wagner Ave
- 214 S Wagner Ave
- 209 S Wagner Ave
- 1112 Fisher Ave
- 118 N Wagner Ave
- 119 S Wagner Ave
- 218 N Wagner Ave
- 218 S Wagner Ave
- 204 S Rauthland Ave
- 202 S Rauthland Ave
- 1006 Fisher Ave
- 206 S Rauthland Ave