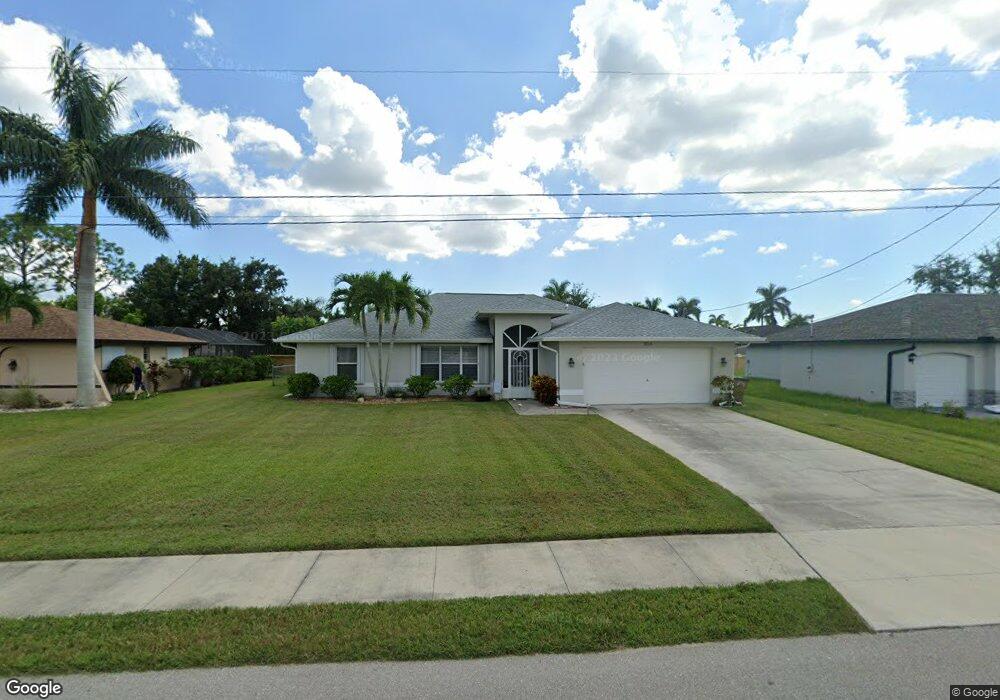
204 SE 8th St Cape Coral, FL 33990
Hancock NeighborhoodEstimated Value: $296,073 - $376,000
3
Beds
2
Baths
1,914
Sq Ft
$176/Sq Ft
Est. Value
About This Home
This home is located at 204 SE 8th St, Cape Coral, FL 33990 and is currently estimated at $336,018, approximately $175 per square foot. 204 SE 8th St is a home located in Lee County with nearby schools including Caloosa Elementary School, Tropic Isles Elementary School, and Hancock Creek Elementary School.
Ownership History
Date
Name
Owned For
Owner Type
Purchase Details
Closed on
Oct 19, 2021
Sold by
Moser Glen J and Moser Gayle D
Bought by
Moser Glen J and Moser Gayle D
Current Estimated Value
Purchase Details
Closed on
Jun 1, 2009
Sold by
Coia Salvatore
Bought by
Moser Glen J
Home Financials for this Owner
Home Financials are based on the most recent Mortgage that was taken out on this home.
Original Mortgage
$80,000
Outstanding Balance
$50,627
Interest Rate
4.8%
Mortgage Type
Unknown
Estimated Equity
$285,391
Purchase Details
Closed on
Mar 2, 2005
Sold by
Soyke Juergen
Bought by
Coia Salvatore
Home Financials for this Owner
Home Financials are based on the most recent Mortgage that was taken out on this home.
Original Mortgage
$150,000
Interest Rate
13.5%
Mortgage Type
Unknown
Purchase Details
Closed on
Oct 28, 2004
Sold by
Marcinkiewicz Lilliane
Bought by
Soyke Juergen
Purchase Details
Closed on
Aug 10, 2004
Sold by
Zimmerman Esther C
Bought by
Marcinkiewicz Lilliane
Create a Home Valuation Report for This Property
The Home Valuation Report is an in-depth analysis detailing your home's value as well as a comparison with similar homes in the area
Home Values in the Area
Average Home Value in this Area
Purchase History
| Date | Buyer | Sale Price | Title Company |
|---|---|---|---|
| Moser Glen J | -- | Accommodation | |
| Moser Glen J | $125,000 | Attorney | |
| Coia Salvatore | $75,000 | Cape Coral Title Insurance A | |
| Soyke Juergen | $41,000 | -- | |
| Marcinkiewicz Lilliane | $39,000 | First Cmnty Title Svcs Inc |
Source: Public Records
Mortgage History
| Date | Status | Borrower | Loan Amount |
|---|---|---|---|
| Open | Moser Glen J | $80,000 | |
| Previous Owner | Coia Salvatore | $150,000 |
Source: Public Records
Tax History Compared to Growth
Tax History
| Year | Tax Paid | Tax Assessment Tax Assessment Total Assessment is a certain percentage of the fair market value that is determined by local assessors to be the total taxable value of land and additions on the property. | Land | Improvement |
|---|---|---|---|---|
| 2025 | $1,852 | $104,280 | -- | -- |
| 2024 | $1,727 | $101,341 | -- | -- |
| 2023 | $1,727 | $98,389 | $0 | $0 |
| 2022 | $1,541 | $95,523 | $0 | $0 |
| 2021 | $1,486 | $195,233 | $25,554 | $169,679 |
| 2020 | $1,473 | $91,461 | $0 | $0 |
| 2019 | $1,416 | $89,405 | $0 | $0 |
| 2018 | $1,393 | $87,738 | $0 | $0 |
| 2017 | $1,372 | $85,933 | $0 | $0 |
| 2016 | $1,311 | $144,479 | $17,301 | $127,178 |
| 2015 | $1,292 | $125,691 | $16,189 | $109,502 |
| 2014 | $1,224 | $110,101 | $13,190 | $96,911 |
| 2013 | -- | $100,702 | $6,028 | $94,674 |
Source: Public Records
Map
Nearby Homes
- 140 SE 8th St
- 217 SE 7th St
- 202 SE 1st Place
- 134 SE 8th St
- 260 Destiny Cir
- 223 Destiny Cir
- 824 SE 3rd Place
- 309 SE 8th St
- 238 SE 9th Terrace
- 213 SE 6th St
- 159 SE 6th St
- 814 Santa Barbara Blvd
- 826 Santa Barbara Blvd
- 834 Santa Barbara Blvd
- 904 SE 4th Place
- 117 SE 10th Terrace
- 804 SW Santa Barbara Place
- 501 SE 7th St
- 505 SE 7th St
- 507 SE 8th Terrace
- 160 SE 8th St
- 208 SE 8th St
- 167 Destiny Cir
- 171 Destiny Cir
- 156 SE 8th St
- 163 Destiny Cir
- 201 SE 8th St
- 205 SE 8th St
- 214 SE 8th St
- 175 Destiny Cir
- 159 Destiny Cir
- 209 SE 8th St
- 157 SE 8th St
- 179 Destiny Cir
- 152 SE 8th St
- 155 Destiny Cir
- 153 SE 8th St
- 213 SE 8th St
- 218 SE 8th St
- 202 SE 7th St Unit 2706397-90188