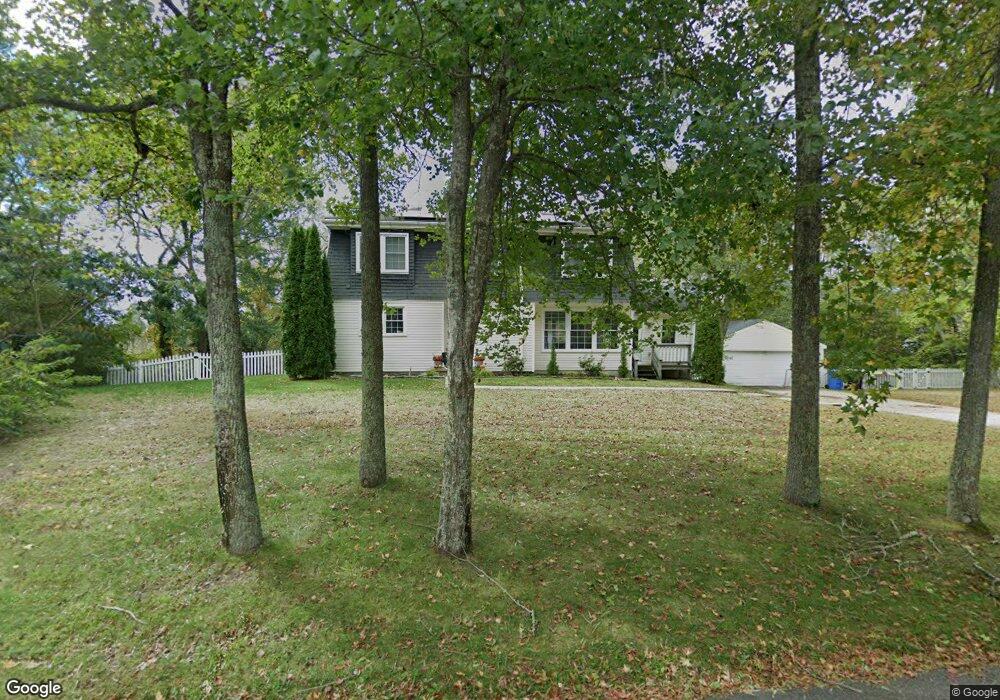
204 Seaside Ave Marmora, NJ 08223
Estimated Value: $497,000 - $569,000
3
Beds
3
Baths
2,240
Sq Ft
$237/Sq Ft
Est. Value
About This Home
This home is located at 204 Seaside Ave, Marmora, NJ 08223 and is currently estimated at $529,834, approximately $236 per square foot. 204 Seaside Ave is a home located in Cape May County with nearby schools including Upper Township Primary School, Upper Township Elementary School, and Upper Township Middle School.
Ownership History
Date
Name
Owned For
Owner Type
Purchase Details
Closed on
Jan 17, 2017
Sold by
Hudrick James W and Hudrick Ashley Dawn
Bought by
Elberson James M and Elberson Aimee
Current Estimated Value
Home Financials for this Owner
Home Financials are based on the most recent Mortgage that was taken out on this home.
Original Mortgage
$251,010
Outstanding Balance
$207,091
Interest Rate
4.16%
Mortgage Type
New Conventional
Estimated Equity
$322,743
Purchase Details
Closed on
Jan 13, 2012
Sold by
Mcdaniels William J
Bought by
Hudrick James W
Home Financials for this Owner
Home Financials are based on the most recent Mortgage that was taken out on this home.
Original Mortgage
$228,765
Interest Rate
3.87%
Mortgage Type
FHA
Purchase Details
Closed on
Mar 28, 2011
Sold by
The Estate Of Murray Stahl and Houser Lynette
Bought by
Mcdaniels William J
Create a Home Valuation Report for This Property
The Home Valuation Report is an in-depth analysis detailing your home's value as well as a comparison with similar homes in the area
Home Values in the Area
Average Home Value in this Area
Purchase History
| Date | Buyer | Sale Price | Title Company |
|---|---|---|---|
| Elberson James M | $243,500 | The Title Company Of Jersey | |
| Hudrick James W | $239,000 | The Title Company Of Jersey | |
| Mcdaniels William J | $140,000 | Title Company Of Jersey |
Source: Public Records
Mortgage History
| Date | Status | Borrower | Loan Amount |
|---|---|---|---|
| Open | Elberson James M | $251,010 | |
| Previous Owner | Hudrick James W | $228,765 |
Source: Public Records
Tax History Compared to Growth
Tax History
| Year | Tax Paid | Tax Assessment Tax Assessment Total Assessment is a certain percentage of the fair market value that is determined by local assessors to be the total taxable value of land and additions on the property. | Land | Improvement |
|---|---|---|---|---|
| 2025 | $5,845 | $254,700 | $124,200 | $130,500 |
| 2024 | $5,845 | $254,700 | $124,200 | $130,500 |
| 2023 | $5,558 | $254,700 | $124,200 | $130,500 |
| 2022 | $5,354 | $254,700 | $124,200 | $130,500 |
| 2021 | $5,160 | $254,700 | $124,200 | $130,500 |
| 2020 | $4,964 | $254,700 | $124,200 | $130,500 |
| 2019 | $4,832 | $254,700 | $124,200 | $130,500 |
| 2018 | $4,704 | $254,700 | $124,200 | $130,500 |
| 2017 | $4,646 | $254,700 | $124,200 | $130,500 |
| 2016 | $4,628 | $249,500 | $124,200 | $125,300 |
| 2015 | $4,503 | $249,500 | $124,200 | $125,300 |
| 2014 | $3,754 | $255,000 | $135,700 | $119,300 |
Source: Public Records
Map
Nearby Homes
- 100 Bayview Ave
- 19 Bayview Ave
- 11 Evio John Ct
- 4 Bayview Ave
- 731 Oceancrest Ave
- 705 Route Us 9 S
- 28 Queen Anne Ct
- 46 Victoria Ln
- 40 Butter Rd
- 1233 Route 9
- 124 Butter Rd
- 24 E Timber Dr
- 734 Stagecoach Rd
- 430 S Shore Rd
- 246 Egret Ln
- 209 Bark Dr
- 1731 Route 9 Unit 28
- 1729 Shore Rd
- 157 Flinders Reef Unit First floor
- 4 Sandcastle Dr
- 200 Seaside Ave
- 927 Sea Sounds Ave
- 205 Seaside Ave
- 209 Seaside Ave
- 929 Sea Sounds Ave
- 201 Seaside Ave
- 120 Seaside Ave
- 115 Bayview Ave
- 206 Pacific Ave
- 210 Pacific Ave
- 935 Sea Sounds Ave
- 119 Seaside Ave
- 612 Ocean Ave
- 614 Ocean Ave
- 118 Pacific Ave
- 115 Seaside Ave
- 112 Seaside Ave
- 941 Sea Sounds Ave
- 109 Bayview Ave
- 112 Bayview Ave