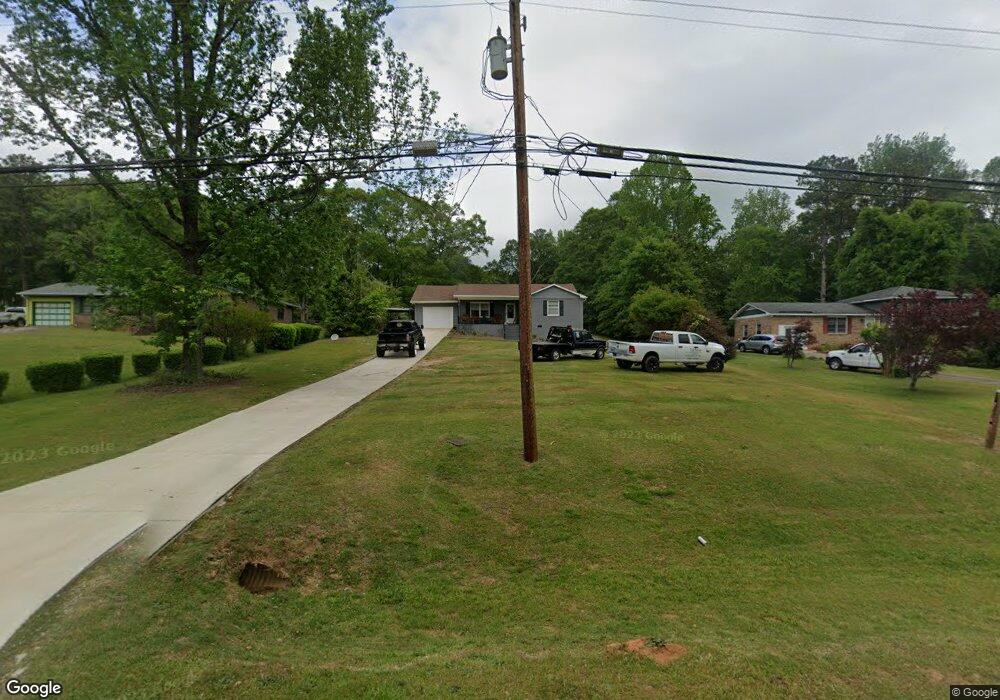
204 Sivell Rd Lagrange, GA 30241
Estimated Value: $170,000 - $224,000
3
Beds
2
Baths
1,508
Sq Ft
$136/Sq Ft
Est. Value
About This Home
This home is located at 204 Sivell Rd, Lagrange, GA 30241 and is currently estimated at $204,669, approximately $135 per square foot. 204 Sivell Rd is a home located in Troup County with nearby schools including Callaway Elementary School, Hogansville Elementary School, and Callaway Middle School.
Ownership History
Date
Name
Owned For
Owner Type
Purchase Details
Closed on
Jan 8, 2024
Sold by
Mccann Timothy Oneal
Bought by
Mccann Betty Jo
Current Estimated Value
Purchase Details
Closed on
Sep 4, 2014
Sold by
Dudenhoeffer Donald T
Bought by
Mccann Timothy Oneal
Home Financials for this Owner
Home Financials are based on the most recent Mortgage that was taken out on this home.
Original Mortgage
$87,000
Interest Rate
4.2%
Mortgage Type
New Conventional
Purchase Details
Closed on
Sep 6, 1984
Sold by
Escobar Ricardo R and Escobar Maria R
Bought by
Dudenhoeffer Donald T
Purchase Details
Closed on
Oct 24, 1975
Sold by
Howard Eugene Fowler
Bought by
Escobar Ricardo R and Escobar Maria R
Purchase Details
Closed on
Jan 1, 1973
Sold by
Robert L Bales
Bought by
Howard Eugene Fowler
Purchase Details
Closed on
Jan 1, 1972
Bought by
Robert L Bales
Create a Home Valuation Report for This Property
The Home Valuation Report is an in-depth analysis detailing your home's value as well as a comparison with similar homes in the area
Home Values in the Area
Average Home Value in this Area
Purchase History
| Date | Buyer | Sale Price | Title Company |
|---|---|---|---|
| Mccann Betty Jo | -- | -- | |
| Mccann Timothy Oneal | $87,000 | -- | |
| Dudenhoeffer Donald T | $58,900 | -- | |
| Escobar Ricardo R | -- | -- | |
| Howard Eugene Fowler | -- | -- | |
| Robert L Bales | -- | -- |
Source: Public Records
Mortgage History
| Date | Status | Borrower | Loan Amount |
|---|---|---|---|
| Previous Owner | Mccann Timothy Oneal | $87,000 |
Source: Public Records
Tax History Compared to Growth
Tax History
| Year | Tax Paid | Tax Assessment Tax Assessment Total Assessment is a certain percentage of the fair market value that is determined by local assessors to be the total taxable value of land and additions on the property. | Land | Improvement |
|---|---|---|---|---|
| 2024 | $1,889 | $71,268 | $10,000 | $61,268 |
| 2023 | $1,830 | $69,096 | $10,000 | $59,096 |
| 2022 | $1,767 | $65,296 | $10,000 | $55,296 |
| 2021 | $1,384 | $47,892 | $8,000 | $39,892 |
| 2020 | $1,384 | $47,892 | $8,000 | $39,892 |
| 2019 | $1,146 | $39,980 | $4,800 | $35,180 |
| 2018 | $959 | $33,776 | $6,000 | $27,776 |
| 2017 | $959 | $33,776 | $6,000 | $27,776 |
| 2016 | $930 | $32,823 | $6,000 | $26,823 |
| 2015 | $932 | $32,823 | $6,000 | $26,823 |
| 2014 | $898 | $29,673 | $6,000 | $23,673 |
| 2013 | -- | $28,926 | $6,000 | $22,926 |
Source: Public Records
Map
Nearby Homes
- 2995 Hogansville Rd
- 100 Shamrock Dr
- 106 Hazel Way
- 234 River Meadow Dr
- 200 River Meadow Dr
- Tucker FP Plan at Crossvine Village
- Nelson Plan at Crossvine Village
- Carter Plan at Crossvine Village
- Hemingway Plan at Crossvine Village
- Jodeco FP Plan at Crossvine Village
- Madison Plan at Crossvine Village
- Winston Plan at Crossvine Village
- Mira Plan at Crossvine Village
- Sierra Plan at Crossvine Village
- Cecil Plan at Crossvine Village
- Nottely Plan at Crossvine Village
- 206 Freshwater Ct
- 204 Freshwater Ct
- 205 Freshwater Ct
- 205 Freshwater Ct Unit E33