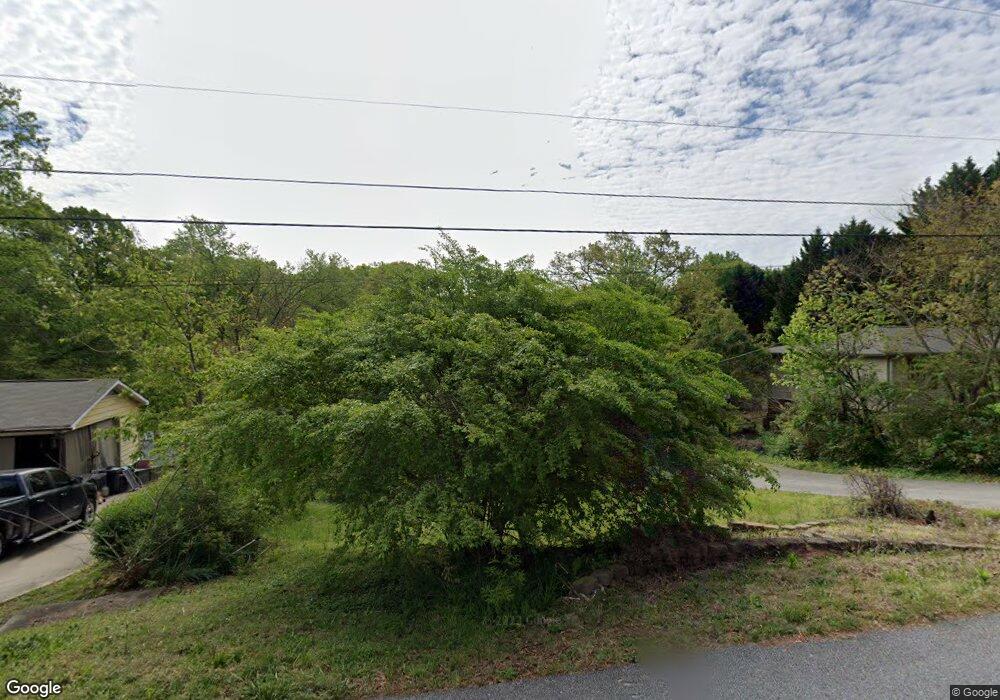
204 Tramrod Trail Travelers Rest, SC 29690
Estimated Value: $214,454 - $264,000
3
Beds
1
Bath
990
Sq Ft
$253/Sq Ft
Est. Value
About This Home
This home is located at 204 Tramrod Trail, Travelers Rest, SC 29690 and is currently estimated at $250,114, approximately $252 per square foot. 204 Tramrod Trail is a home located in Greenville County with nearby schools including Gateway Elementary School, Blue Ridge Middle School, and Blue Ridge High School.
Ownership History
Date
Name
Owned For
Owner Type
Purchase Details
Closed on
Nov 17, 2016
Sold by
Hendrix Eleanor R
Bought by
Hendrix Daniel P
Current Estimated Value
Purchase Details
Closed on
Nov 15, 2010
Sold by
Fisher Rachael Billings and Fisher Jeremy
Bought by
Hendrix Daniel P and Hendrix Eleanor R
Home Financials for this Owner
Home Financials are based on the most recent Mortgage that was taken out on this home.
Original Mortgage
$103,500
Outstanding Balance
$68,496
Interest Rate
4.33%
Mortgage Type
New Conventional
Estimated Equity
$181,618
Purchase Details
Closed on
May 30, 2006
Sold by
Hawkins Cynthia M
Bought by
Billings Rachael and Billings Suzanne R
Home Financials for this Owner
Home Financials are based on the most recent Mortgage that was taken out on this home.
Original Mortgage
$75,520
Interest Rate
8.5%
Mortgage Type
Purchase Money Mortgage
Purchase Details
Closed on
Nov 22, 2004
Sold by
Davenport Cynthia M
Bought by
Hawkins Cynthia M
Create a Home Valuation Report for This Property
The Home Valuation Report is an in-depth analysis detailing your home's value as well as a comparison with similar homes in the area
Home Values in the Area
Average Home Value in this Area
Purchase History
| Date | Buyer | Sale Price | Title Company |
|---|---|---|---|
| Hendrix Daniel P | -- | None Available | |
| Hendrix Daniel P | $100,000 | -- | |
| Billings Rachael | $94,400 | None Available | |
| Hawkins Cynthia M | -- | -- |
Source: Public Records
Mortgage History
| Date | Status | Borrower | Loan Amount |
|---|---|---|---|
| Open | Hendrix Daniel P | $103,500 | |
| Previous Owner | Billings Rachael | $75,520 |
Source: Public Records
Tax History Compared to Growth
Tax History
| Year | Tax Paid | Tax Assessment Tax Assessment Total Assessment is a certain percentage of the fair market value that is determined by local assessors to be the total taxable value of land and additions on the property. | Land | Improvement |
|---|---|---|---|---|
| 2024 | $787 | $4,050 | $550 | $3,500 |
| 2023 | $787 | $4,050 | $550 | $3,500 |
| 2022 | $768 | $4,050 | $550 | $3,500 |
| 2021 | $754 | $4,050 | $550 | $3,500 |
| 2020 | $704 | $3,520 | $700 | $2,820 |
| 2019 | $697 | $3,520 | $700 | $2,820 |
| 2018 | $747 | $3,520 | $700 | $2,820 |
| 2017 | $740 | $3,520 | $700 | $2,820 |
| 2016 | $702 | $88,090 | $17,500 | $70,590 |
| 2015 | $695 | $88,090 | $17,500 | $70,590 |
| 2014 | $696 | $89,328 | $17,003 | $72,325 |
Source: Public Records
Map
Nearby Homes
- 209 Tramrod Trail
- 4712 State Park Rd
- 4724 State Park Rd
- 112 Knox Valley Ln
- 125 Turner Cir
- 430 Tanyard Rd
- 15 Hindman Rd
- 11 Cougar Ln
- 5 Tammy Trail
- 2 Cauley Dr Unit 30
- 8 Overlook Ct
- 2070 Little Texas Rd
- 103 Paladium Place
- 705 Ravel Ct
- 4035 State Park Rd
- 5 Winding Walk Way
- 67 Devonhall Way
- 368 Old Batson Rd
- 121 Berrow Way
- 24 Bay Point Way
- 202 Tramrod Trail
- 206 Tramrod Trail
- 44 Carriage Dr
- 46 Carriage Dr
- 200 Tramrod Trail
- 208 Tramrod Trail
- 207 Tramrod Trail
- 3 Cadillac Ct
- 210 Tramrod Trail
- 48 Carriage Dr
- 40 Carriage Dr
- 387 Clearview Cir
- 385 Clearview Cir
- 5 Cadillac Ct
- 383 Clearview Cir
- 212 Tramrod Trail
- 211 Tramrod Trail
- 2 Cadillac Ct
- 41 Carriage Dr
- 391 Clearview Cir