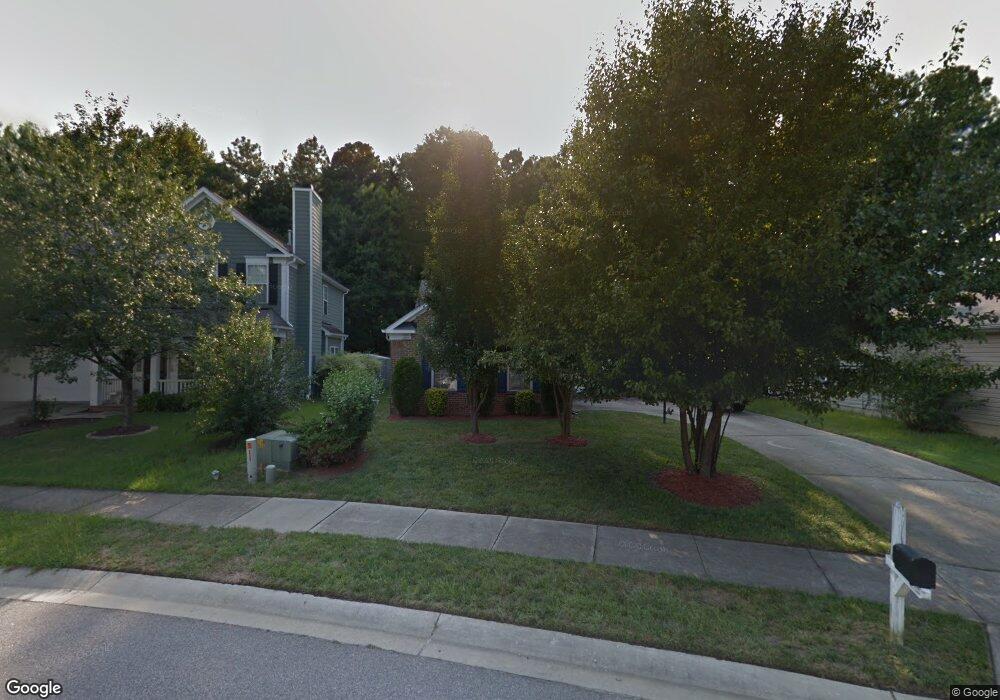
204 Tullich Way Holly Springs, NC 27540
Estimated Value: $394,000 - $419,000
3
Beds
2
Baths
1,525
Sq Ft
$266/Sq Ft
Est. Value
About This Home
This home is located at 204 Tullich Way, Holly Springs, NC 27540 and is currently estimated at $405,603, approximately $265 per square foot. 204 Tullich Way is a home located in Wake County with nearby schools including Oakview Elementary School, Apex Friendship Middle School, and Holly Springs High School.
Ownership History
Date
Name
Owned For
Owner Type
Purchase Details
Closed on
Mar 3, 2004
Sold by
Mckoy Dechona Bullock
Bought by
Mckoy Tiecel Luther
Current Estimated Value
Purchase Details
Closed on
Jul 19, 2002
Sold by
Baker Steven and Baker Lori
Bought by
Mckoy Tiecel and Mckoy Dechona
Home Financials for this Owner
Home Financials are based on the most recent Mortgage that was taken out on this home.
Original Mortgage
$143,366
Outstanding Balance
$60,603
Interest Rate
6.67%
Mortgage Type
FHA
Estimated Equity
$345,000
Purchase Details
Closed on
Dec 30, 1999
Sold by
Beazer Home Corp
Bought by
Baker Steven and Baker Lori
Home Financials for this Owner
Home Financials are based on the most recent Mortgage that was taken out on this home.
Original Mortgage
$138,756
Interest Rate
7.68%
Mortgage Type
FHA
Purchase Details
Closed on
Jan 15, 1999
Sold by
Oakhall Ltd Partnership
Bought by
Beazer Homes Corp
Create a Home Valuation Report for This Property
The Home Valuation Report is an in-depth analysis detailing your home's value as well as a comparison with similar homes in the area
Home Values in the Area
Average Home Value in this Area
Purchase History
| Date | Buyer | Sale Price | Title Company |
|---|---|---|---|
| Mckoy Tiecel Luther | -- | -- | |
| Mckoy Tiecel | $144,500 | -- | |
| Baker Steven | $140,000 | -- | |
| Beazer Homes Corp | $126,000 | -- |
Source: Public Records
Mortgage History
| Date | Status | Borrower | Loan Amount |
|---|---|---|---|
| Open | Mckoy Tiecel | $143,366 | |
| Previous Owner | Baker Steven | $138,756 |
Source: Public Records
Tax History Compared to Growth
Tax History
| Year | Tax Paid | Tax Assessment Tax Assessment Total Assessment is a certain percentage of the fair market value that is determined by local assessors to be the total taxable value of land and additions on the property. | Land | Improvement |
|---|---|---|---|---|
| 2025 | $3,482 | $402,278 | $115,000 | $287,278 |
| 2024 | $3,468 | $402,278 | $115,000 | $287,278 |
| 2023 | $2,782 | $256,089 | $50,000 | $206,089 |
| 2022 | $2,686 | $256,089 | $50,000 | $206,089 |
| 2021 | $2,636 | $256,089 | $50,000 | $206,089 |
| 2020 | $2,636 | $256,089 | $50,000 | $206,089 |
| 2019 | $2,448 | $201,772 | $50,000 | $151,772 |
| 2018 | $2,213 | $201,772 | $50,000 | $151,772 |
| 2017 | $2,134 | $201,772 | $50,000 | $151,772 |
| 2016 | $2,104 | $201,772 | $50,000 | $151,772 |
| 2015 | $1,909 | $179,953 | $35,000 | $144,953 |
| 2014 | $1,843 | $179,953 | $35,000 | $144,953 |
Source: Public Records
Map
Nearby Homes
- 108 Crabwall Ct
- 225 Douglas St
- 737 W Holly Springs Rd
- 743 W Holly Springs Rd
- 749 W Holly Springs Rd
- 124 Cliffdale Rd
- 755 W Holly Springs Rd
- 761 W Holly Springs Rd
- 717 Starkland Way
- 321 Blalock St
- 112 Burt St
- 105 Cross Hill Ln
- 321 Cross Hill Ln
- 713 Littleleaf Ct
- 105 Townsgate Ct
- 725 Little Leaf Ct
- 318 Blalock St
- 109 Bright Shade Ct
- 405 W Ballentine St
- 329 N Main St
- 200 Tullich Way
- 208 Tullich Way
- 101 Crabwall Ct
- 212 Tullich Way
- 105 Crabwall Ct
- 153 Gremar Dr Unit 42 Avalon II C
- 201 Tullich Way
- 151 Gremar Dr Unit 41
- 155 Gremar Dr Unit 43 Carson II C
- 155 Gremar Dr
- 149 Gremar Dr
- 149 Gremar Dr Unit 40
- 157 Gremar Dr Unit 44 Brady II A
- 157 Gremar Dr
- 147 Gremar Dr
- 147 Gremar Dr Unit 39 Carson II C
- 216 Tullich Way
- 205 Tullich Way
- 159 Gremar Dr
- 159 Gremar Dr Unit 45 Carson II F