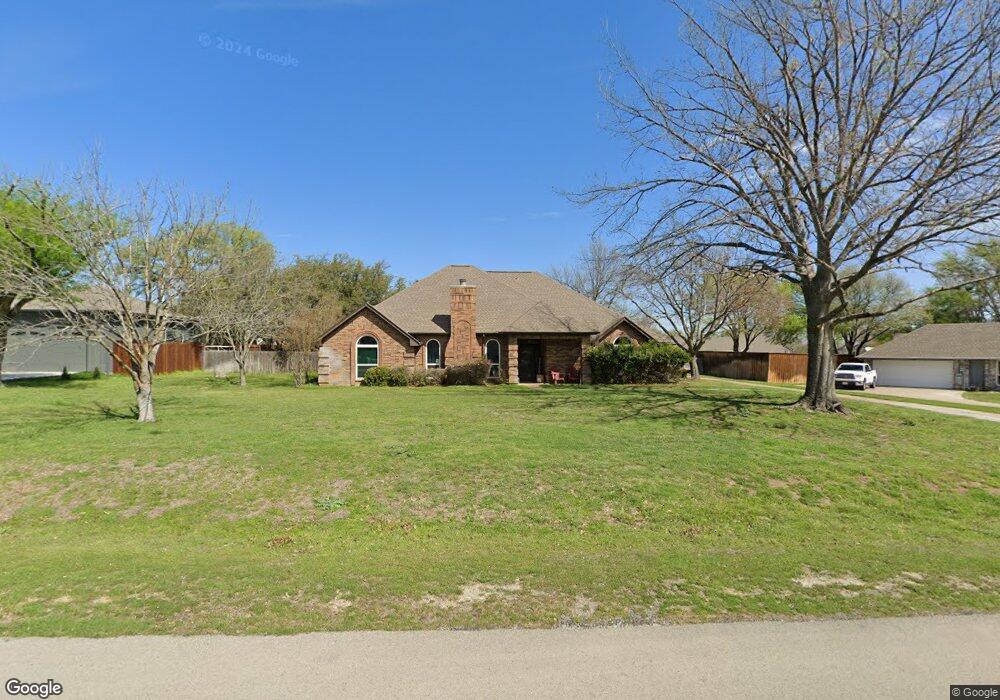
204 Valley Ranch Rd Weatherford, TX 76087
Estimated Value: $470,000 - $524,147
4
Beds
3
Baths
2,405
Sq Ft
$206/Sq Ft
Est. Value
About This Home
This home is located at 204 Valley Ranch Rd, Weatherford, TX 76087 and is currently estimated at $496,287, approximately $206 per square foot. 204 Valley Ranch Rd is a home located in Parker County with nearby schools including Martin Elementary School, Tison Middle School, and Weatherford High School.
Ownership History
Date
Name
Owned For
Owner Type
Purchase Details
Closed on
Aug 4, 2017
Sold by
The Darrell Chester Mohr Revocable Famil
Bought by
Thomas Ashlyan L and Thomas Tyrone J
Current Estimated Value
Home Financials for this Owner
Home Financials are based on the most recent Mortgage that was taken out on this home.
Original Mortgage
$264,325
Outstanding Balance
$219,137
Interest Rate
3.9%
Mortgage Type
New Conventional
Estimated Equity
$277,150
Purchase Details
Closed on
Oct 15, 2013
Sold by
Mohr Darrell C and Mohr Wendy L
Bought by
Mohr Darrell Chester Revocable Family Trust
Purchase Details
Closed on
Oct 12, 2007
Sold by
Mohr Darrell C
Bought by
Mohr Darrell Chester Revocable Family Trust
Purchase Details
Closed on
Sep 14, 1988
Bought by
Mohr Darrell Chester Revocable Family Trust
Create a Home Valuation Report for This Property
The Home Valuation Report is an in-depth analysis detailing your home's value as well as a comparison with similar homes in the area
Home Values in the Area
Average Home Value in this Area
Purchase History
| Date | Buyer | Sale Price | Title Company |
|---|---|---|---|
| Thomas Ashlyan L | -- | None Available | |
| Mohr Darrell Chester Revocable Family Trust | -- | -- | |
| Darrell Chester Mohr Revocable Family Tr | -- | None Available | |
| Mohr Darrell Chester Revocable Family Trust | -- | -- | |
| Mohr Darrell Chester Revocable Family Trust | -- | -- |
Source: Public Records
Mortgage History
| Date | Status | Borrower | Loan Amount |
|---|---|---|---|
| Open | Thomas Ashlyan L | $264,325 |
Source: Public Records
Tax History Compared to Growth
Tax History
| Year | Tax Paid | Tax Assessment Tax Assessment Total Assessment is a certain percentage of the fair market value that is determined by local assessors to be the total taxable value of land and additions on the property. | Land | Improvement |
|---|---|---|---|---|
| 2025 | $7,489 | $486,505 | -- | -- |
| 2024 | $7,489 | $442,277 | -- | -- |
| 2023 | $7,489 | $402,070 | $0 | $0 |
| 2022 | $7,704 | $347,340 | $30,000 | $317,340 |
| 2021 | $8,056 | $347,340 | $30,000 | $317,340 |
| 2020 | $7,368 | $307,430 | $30,000 | $277,430 |
| 2019 | $7,079 | $307,430 | $30,000 | $277,430 |
| 2018 | $6,464 | $252,020 | $30,000 | $222,020 |
| 2017 | $5,942 | $225,820 | $30,000 | $195,820 |
| 2016 | $5,609 | $213,170 | $25,000 | $188,170 |
| 2015 | $5,123 | $213,170 | $25,000 | $188,170 |
| 2014 | $4,759 | $197,830 | $25,000 | $172,830 |
Source: Public Records
Map
Nearby Homes
- 221 Valley Ranch Rd
- 3210 Bluebonnet Cir
- 3409 Foot Hills Dr
- 2911 Inspiration Dr
- 302 Red Eagle Trail
- 3509 Lakeshore Dr
- 3609 Marina Link
- TBA N Oakridge Dr
- 109 Norene Ln
- 3610 Lakeshore Dr
- 3503 Red Bud Dr
- 3606 Bluebonnet Cir
- 203 Newell Dr Unit R
- 3616 Overlook Manor
- 408 Canyon Trail Rd
- 207 Newell Dr
- 318 W Lake Dr
- 304 Newell Dr Unit R
- 304 Newell Dr Unit C
- 113 Green Oaks Ct
- 207 Lake Hollow Dr
- 206 Valley Ranch Rd
- 209 Lake Hollow Dr
- 201 Valley Ranch Rd
- 208 Timber Trail
- 203 Valley Ranch Rd
- 210 Timber Trail
- 205 Valley Ranch Rd
- 204 Lake Hollow Dr
- 206 Timber Trail
- 202 Timber Trail
- 211 Lake Hollow Dr
- 208 Lake Hollow Dr
- 203 Lake Hollow Dr
- 203 Lake Hollow Dr Unit 2120
- 206 Lake Hollow Dr
- 212 Timber Trail
- 3127 Cimmarron Rd
- 207 Valley Ranch Rd
- 202 Lake Hollow Dr