204 Vine St Paso Robles, CA 93446
Estimated Value: $721,720 - $1,416,000
About This Home
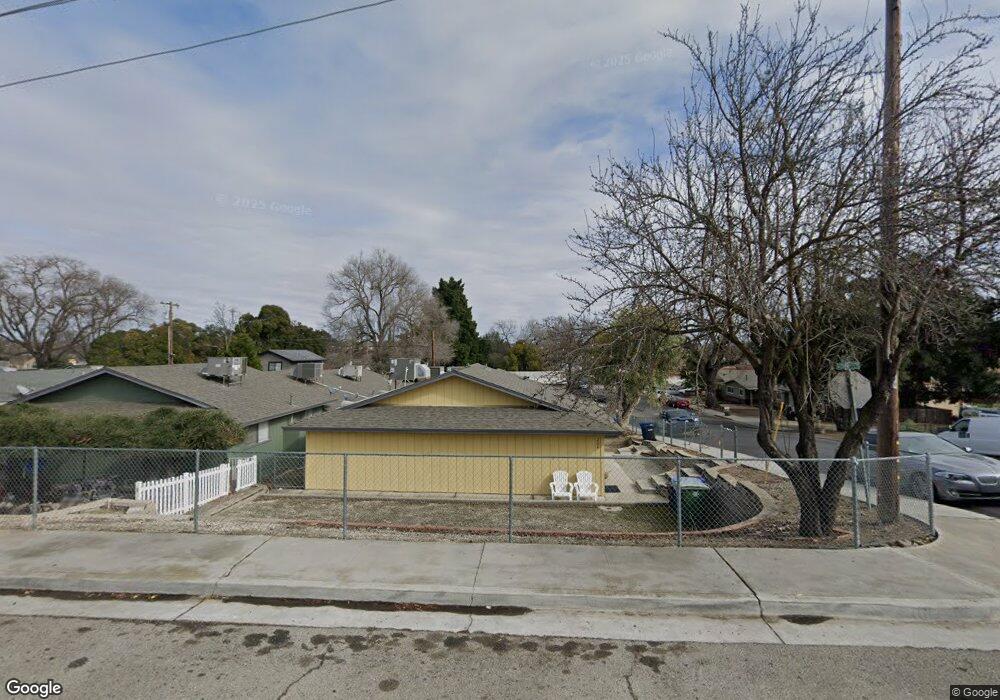
This home is located at 204 Vine St, Paso Robles, CA 93446 and is currently estimated at $1,035,430, approximately $352 per square foot. 204 Vine St is a home located in San Luis Obispo County with nearby schools including Glen Speck Elementary School, George H. Flamson Middle School, and Paso Robles High School.
Ownership History
We collect this data history from publicly available records. To have your information removed, we recommend requesting removal directly through your county’s website.
Purchase Details
Purchase Details
Home Financials for this Owner
Home Financials are based on the most recent Mortgage that was taken out on this home.Purchase History
We collect this data history from publicly available records. To have your information removed, we recommend requesting removal directly through your county’s website.
| Date | Buyer | Sale Price | Title Company |
|---|---|---|---|
| -- | None Available | ||
| $152,000 | First American Title |
Mortgage History
We collect this data history from publicly available records. To have your information removed, we recommend requesting removal directly through your county’s website.
| Date | Status | Borrower | Loan Amount |
|---|---|---|---|
| Previous Owner | $121,600 |
Tax History
We collect this data history from publicly available records. To have your information removed, we recommend requesting removal directly through your county’s website.
| Year | Tax Paid | Tax Assessment Tax Assessment Total Assessment is a certain percentage of the fair market value that is determined by local assessors to be the total taxable value of land and additions on the property. | Land | Improvement |
|---|---|---|---|---|
| 2025 | $2,597 | $238,267 | $70,537 | $167,730 |
| 2024 | $2,555 | $233,596 | $69,154 | $164,442 |
| 2023 | $2,555 | $229,017 | $67,799 | $161,218 |
| 2022 | $2,517 | $224,527 | $66,470 | $158,057 |
| 2021 | $2,474 | $220,125 | $65,167 | $154,958 |
| 2020 | $2,440 | $217,869 | $64,499 | $153,370 |
| 2019 | $2,405 | $213,598 | $63,235 | $150,363 |
| 2018 | $2,373 | $209,411 | $61,996 | $147,415 |
| 2017 | $2,231 | $205,306 | $60,781 | $144,525 |
| 2016 | $2,187 | $201,282 | $59,590 | $141,692 |
| 2015 | $2,179 | $198,259 | $58,695 | $139,564 |
| 2014 | $2,104 | $194,377 | $57,546 | $136,831 |
Map
- 143 Vine St
- 110 Kiler Canyon
- 427 Olive St
- 153 Pacific Ave
- 390 Paso Robles St
- 828 Spring St
- 549 Derby Ln
- 806 Grove St
- 350 Robles Rd
- 215 Hilltop Dr
- 204 Vista Del Rio Ct
- 110 11th St
- 1712 Current Ln
- 192 Sandbar Ct
- 207 Navajo Ave
- 1720 Willowbank Ln
- 1026 Merry Hill Rd
- 310 Oak Grove Ct
- 669 Red Cloud Rd
- 34 Terrace Hill Dr
Ask me questions while you tour the home.