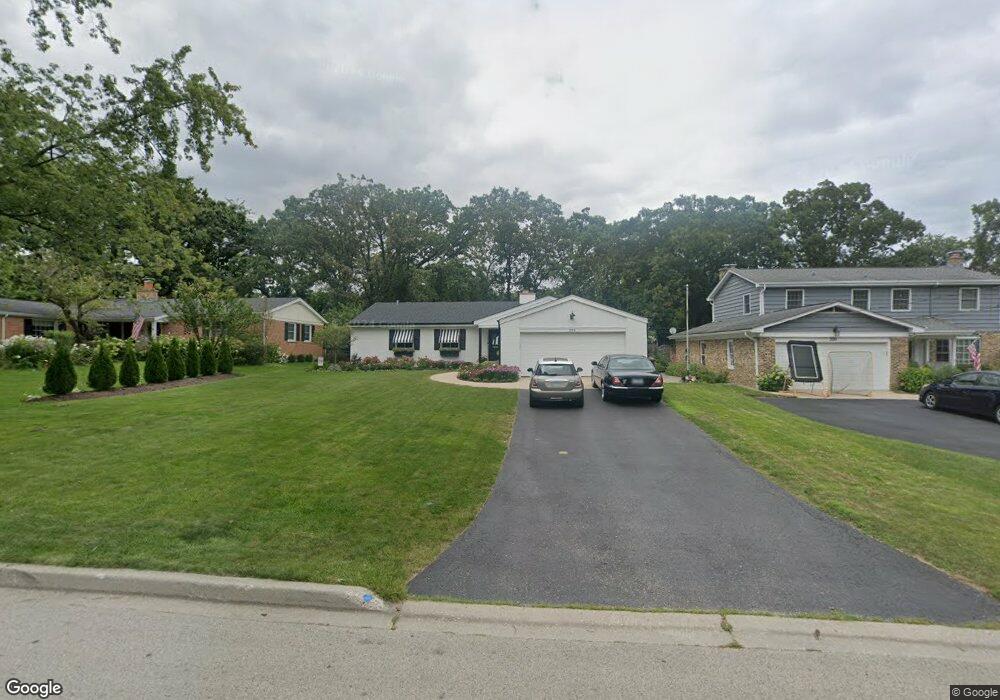
204 W Center Ave Lake Bluff, IL 60044
Estimated Value: $685,230 - $748,000
4
Beds
3
Baths
2,005
Sq Ft
$360/Sq Ft
Est. Value
About This Home
This home is located at 204 W Center Ave, Lake Bluff, IL 60044 and is currently estimated at $720,808, approximately $359 per square foot. 204 W Center Ave is a home located in Lake County with nearby schools including Lake Bluff Elementary School, Lake Bluff Middle School, and Lake Forest High School.
Ownership History
Date
Name
Owned For
Owner Type
Purchase Details
Closed on
Sep 30, 2008
Sold by
Burns Walter A and Burns Kim M
Bought by
Burns Kim M and The Kim Kaiser Burns Revocable
Current Estimated Value
Purchase Details
Closed on
Oct 28, 2005
Sold by
Kendall Radford S and Kendall Catherine
Bought by
Burns Walter A and Burns Kim M
Home Financials for this Owner
Home Financials are based on the most recent Mortgage that was taken out on this home.
Original Mortgage
$240,000
Outstanding Balance
$131,500
Interest Rate
6.04%
Mortgage Type
Credit Line Revolving
Estimated Equity
$589,308
Purchase Details
Closed on
Sep 2, 2005
Sold by
Kendall Catherine
Bought by
Kendall Radford S and Kendall Catherine
Home Financials for this Owner
Home Financials are based on the most recent Mortgage that was taken out on this home.
Original Mortgage
$240,000
Outstanding Balance
$131,500
Interest Rate
6.04%
Mortgage Type
Credit Line Revolving
Estimated Equity
$589,308
Create a Home Valuation Report for This Property
The Home Valuation Report is an in-depth analysis detailing your home's value as well as a comparison with similar homes in the area
Home Values in the Area
Average Home Value in this Area
Purchase History
| Date | Buyer | Sale Price | Title Company |
|---|---|---|---|
| Burns Kim M | -- | None Available | |
| Burns Walter A | $600,000 | Burnet Title Llc | |
| Kendall Radford S | -- | Burnet Title Llc |
Source: Public Records
Mortgage History
| Date | Status | Borrower | Loan Amount |
|---|---|---|---|
| Open | Burns Walter A | $240,000 |
Source: Public Records
Tax History Compared to Growth
Tax History
| Year | Tax Paid | Tax Assessment Tax Assessment Total Assessment is a certain percentage of the fair market value that is determined by local assessors to be the total taxable value of land and additions on the property. | Land | Improvement |
|---|---|---|---|---|
| 2024 | $11,529 | $187,530 | $102,964 | $84,566 |
| 2023 | $10,265 | $166,221 | $91,264 | $74,957 |
| 2022 | $10,265 | $151,106 | $82,965 | $68,141 |
| 2021 | $9,905 | $149,802 | $82,249 | $67,553 |
| 2020 | $10,022 | $155,575 | $82,716 | $72,859 |
| 2019 | $9,662 | $152,720 | $81,198 | $71,522 |
| 2018 | $5,219 | $156,459 | $79,422 | $77,037 |
| 2017 | $9,565 | $153,843 | $78,094 | $75,749 |
| 2016 | $9,211 | $146,434 | $74,333 | $72,101 |
| 2015 | $9,123 | $137,885 | $69,993 | $67,892 |
| 2014 | $8,099 | $122,898 | $62,839 | $60,059 |
| 2012 | $7,607 | $123,964 | $63,384 | $60,580 |
Source: Public Records
Map
Nearby Homes
- 208 Park Ln
- 120 E Scranton Ave Unit 202
- 120 E Scranton Ave Unit 203
- 120 E Scranton Ave Unit 201
- 120 E Scranton Ave Unit 102
- 120 E Scranton Ave Unit 103
- 117 E Washington Ave
- 1061 Green Bay Rd
- 55 Trowbridge Cir
- 321 Newman Ct
- 8 Warrington Dr Unit 1
- 1010 Green Bay Rd
- 28 Warrington Dr
- 166 Park Ave
- 39 Warrington Dr
- 308 Signe Ct
- 246 Park Ave
- 511 Rockland Rd
- 1302 N Green Bay Rd
- 666 Maple Ave
- 210 W Center Ave
- 126 W Center Ave
- 216 W Center Ave
- 516 Lincoln Ave
- 120 W Center Ave
- 224 W Center Ave
- 510 Lincoln Ave
- 225 W Center Ave
- 517 Lincoln Ave
- 114 W Center Ave
- 230 W Center Ave
- 511 Pine Ct
- 511 Lincoln Ave
- 504 Lincoln Ave
- 108 W Center Ave
- 236 W Center Ave
- 505 Pine Ct
- 204 W Scranton Ave
- 610 Lincoln Ave
- 505 Lincoln Ave