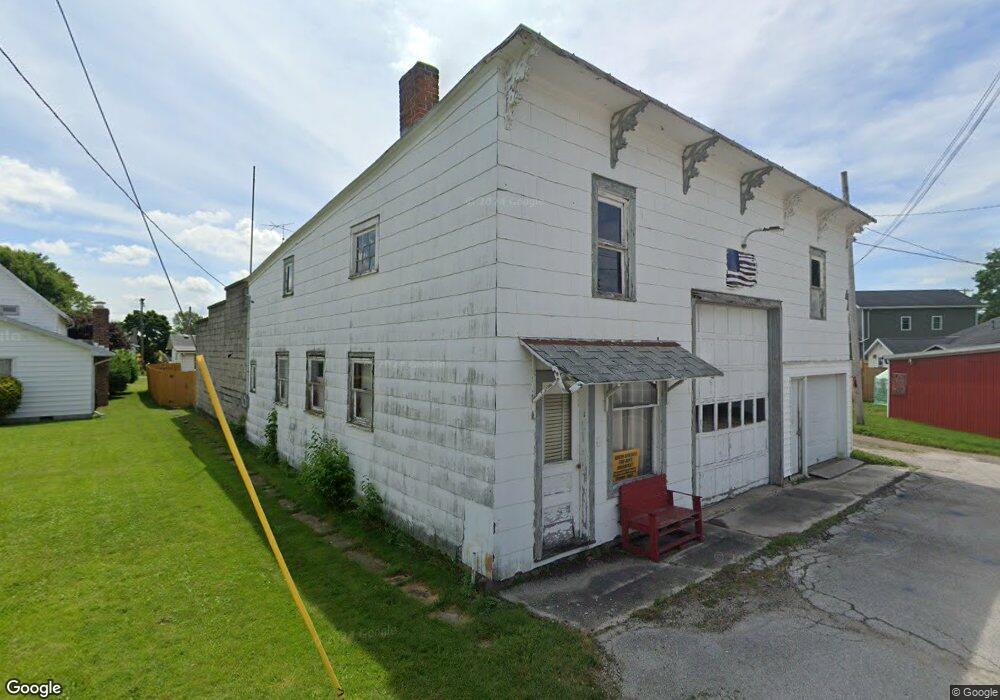
204 W Euclid St Green Springs, OH 44836
Estimated Value: $156,000 - $187,000
3
Beds
2
Baths
2,050
Sq Ft
$82/Sq Ft
Est. Value
About This Home
This home is located at 204 W Euclid St, Green Springs, OH 44836 and is currently estimated at $168,767, approximately $82 per square foot. 204 W Euclid St is a home located in Seneca County with nearby schools including Clyde High School.
Ownership History
Date
Name
Owned For
Owner Type
Purchase Details
Closed on
Apr 5, 2022
Sold by
Alt Patrick J
Bought by
Alt Patrick J and Webb Brenda S
Current Estimated Value
Home Financials for this Owner
Home Financials are based on the most recent Mortgage that was taken out on this home.
Original Mortgage
$120,472
Interest Rate
4.67%
Purchase Details
Closed on
May 1, 2014
Sold by
Thompson Nancy L and Smith Nancy L
Bought by
Alt Patrick J
Purchase Details
Closed on
Dec 21, 2006
Sold by
Schrock Hazel C
Bought by
Alt Patrick J and Smith Nancy L
Home Financials for this Owner
Home Financials are based on the most recent Mortgage that was taken out on this home.
Original Mortgage
$72,250
Interest Rate
6.24%
Mortgage Type
Future Advance Clause Open End Mortgage
Purchase Details
Closed on
Feb 20, 2004
Sold by
Schrock Hazel C T and Schrock O
Bought by
Schrock Hazel C T and Schrock O
Purchase Details
Closed on
Feb 18, 2004
Sold by
Schrock Carl and Schrock Hazel C
Bought by
Schrock Hazel C
Create a Home Valuation Report for This Property
The Home Valuation Report is an in-depth analysis detailing your home's value as well as a comparison with similar homes in the area
Home Values in the Area
Average Home Value in this Area
Purchase History
| Date | Buyer | Sale Price | Title Company |
|---|---|---|---|
| Alt Patrick J | -- | First Integrity Title | |
| Alt Patrick J | -- | None Available | |
| Alt Patrick J | $85,000 | First American Titie Insuran | |
| Schrock Hazel C T | -- | -- | |
| Schrock Hazel C | -- | -- |
Source: Public Records
Mortgage History
| Date | Status | Borrower | Loan Amount |
|---|---|---|---|
| Previous Owner | Alt Patrick J | $120,472 | |
| Previous Owner | Alt Patrick J | $72,250 |
Source: Public Records
Tax History Compared to Growth
Tax History
| Year | Tax Paid | Tax Assessment Tax Assessment Total Assessment is a certain percentage of the fair market value that is determined by local assessors to be the total taxable value of land and additions on the property. | Land | Improvement |
|---|---|---|---|---|
| 2024 | $2,024 | $45,680 | $1,850 | $43,830 |
| 2023 | $2,136 | $45,680 | $1,850 | $43,830 |
| 2022 | $1,329 | $25,840 | $1,360 | $24,480 |
| 2021 | $1,345 | $25,840 | $1,360 | $24,480 |
| 2020 | $1,378 | $25,838 | $1,362 | $24,476 |
| 2019 | $1,486 | $28,522 | $1,544 | $26,978 |
| 2018 | $1,485 | $28,522 | $1,544 | $26,978 |
| 2017 | $1,527 | $28,522 | $1,544 | $26,978 |
| 2016 | $1,234 | $26,345 | $1,390 | $24,955 |
| 2015 | $1,220 | $26,345 | $1,390 | $24,955 |
| 2014 | $2,311 | $26,345 | $1,390 | $24,955 |
| 2013 | $2,414 | $27,111 | $1,435 | $25,676 |
Source: Public Records
Map
Nearby Homes
- 104 Ken Lee Dr
- 220 Maple Ln Unit 82
- 0 N Sr 101 Unit 20252008
- 2114 S Main St
- 236 Spayd Rd
- 0 Merlin Ln Unit 20253762
- 0 Merlin Ln Unit 20253639
- 628 W Maple St
- V/L County Road 220
- 0 County Road 220
- 322 Vine St
- 209 Fair St
- 2314 E Sr 20
- 235 W Buckeye St
- 222 Bertha Ave
- 1270 W Mcpherson Hwy
- 761 N Woodland Ave
- 117 Nelson St
- 167 Excalibur Dr
- 315 E Grant St
- 108 E Euclid St
- 208 E Euclid St
- 210 W Euclid St
- 129 S Clay St
- 125 S Clay St
- 203 S Broadway St
- 127 S Clay St
- 211 S Broadway St
- 126 N Clay St
- 207 S Broadway St
- 127 S Broadway St
- 205 Bobcat Alley
- 0 Twp 32 Rd Unit 117729
- 0 Twp 32 Rd Unit 117730
- 0 Twp 178 Rd Unit 20164618
- 0 Tr-178 Unit 20143985
- 3940 S 198 Rd
- 0 Kenlee Dr
- 8458 E Co 32 Rd
- 7155 E T R 148