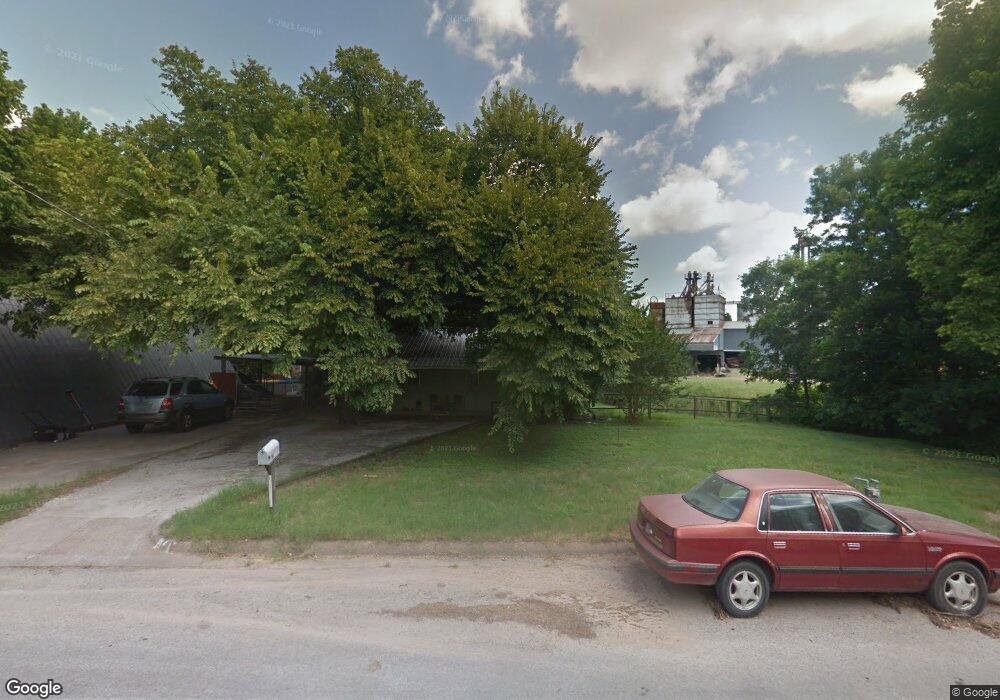
204 W Water St Weatherford, TX 76086
Estimated Value: $188,000 - $254,000
2
Beds
1
Bath
1,056
Sq Ft
$201/Sq Ft
Est. Value
About This Home
This home is located at 204 W Water St, Weatherford, TX 76086 and is currently estimated at $212,444, approximately $201 per square foot. 204 W Water St is a home located in Parker County with nearby schools including Curtis Elementary School, Hall Middle School, and Weatherford High School.
Ownership History
Date
Name
Owned For
Owner Type
Purchase Details
Closed on
Jul 21, 2020
Sold by
Wright Wayland
Bought by
Fontenot Aaron
Current Estimated Value
Home Financials for this Owner
Home Financials are based on the most recent Mortgage that was taken out on this home.
Original Mortgage
$65,000
Interest Rate
3.2%
Mortgage Type
New Conventional
Purchase Details
Closed on
Mar 11, 2010
Sold by
Burkhart Lawrence Wade
Bought by
County Of Parker
Purchase Details
Closed on
Jan 20, 1987
Bought by
Wright Wayland
Create a Home Valuation Report for This Property
The Home Valuation Report is an in-depth analysis detailing your home's value as well as a comparison with similar homes in the area
Home Values in the Area
Average Home Value in this Area
Purchase History
| Date | Buyer | Sale Price | Title Company |
|---|---|---|---|
| Fontenot Aaron | -- | None Available | |
| County Of Parker | -- | None Available | |
| Wright Wayland | -- | -- |
Source: Public Records
Mortgage History
| Date | Status | Borrower | Loan Amount |
|---|---|---|---|
| Previous Owner | Fontenot Aaron | $65,000 |
Source: Public Records
Tax History Compared to Growth
Tax History
| Year | Tax Paid | Tax Assessment Tax Assessment Total Assessment is a certain percentage of the fair market value that is determined by local assessors to be the total taxable value of land and additions on the property. | Land | Improvement |
|---|---|---|---|---|
| 2025 | $1,186 | $126,784 | -- | -- |
| 2024 | $1,186 | $115,258 | -- | -- |
| 2023 | $1,186 | $104,780 | $0 | $0 |
| 2022 | $2,113 | $95,260 | $15,000 | $80,260 |
| 2021 | $2,288 | $95,260 | $15,000 | $80,260 |
| 2020 | $1,914 | $79,210 | $15,000 | $64,210 |
| 2019 | $2,023 | $79,210 | $15,000 | $64,210 |
| 2018 | $1,881 | $73,350 | $15,000 | $58,350 |
| 2017 | $1,930 | $73,350 | $15,000 | $58,350 |
| 2016 | $1,705 | $64,810 | $15,000 | $49,810 |
| 2015 | $1,670 | $64,810 | $15,000 | $49,810 |
| 2014 | $1,531 | $60,980 | $15,000 | $45,980 |
Source: Public Records
Map
Nearby Homes