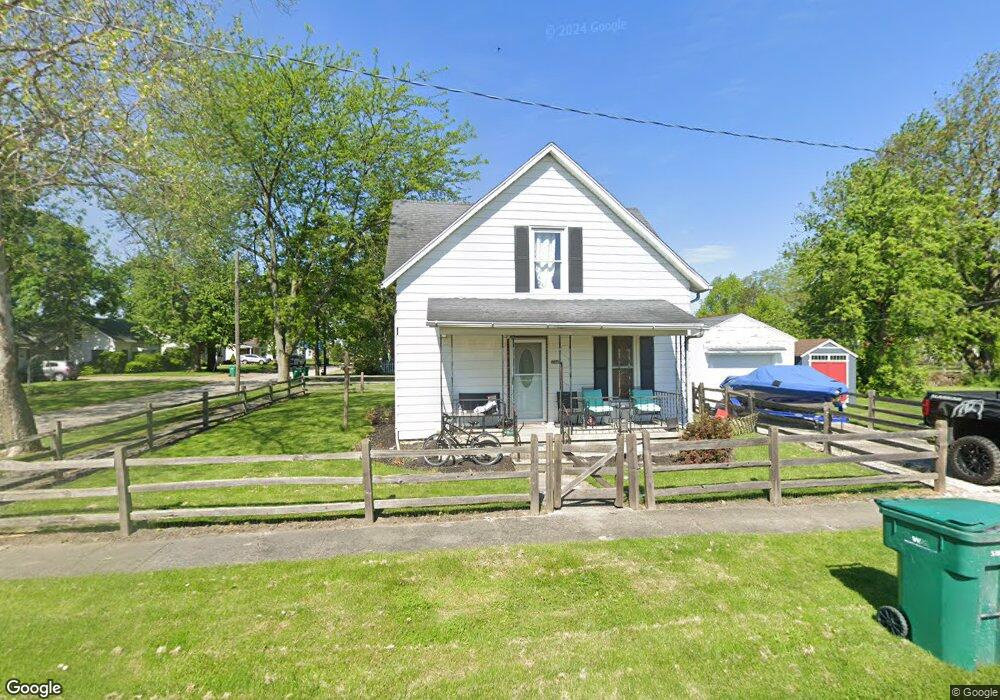
204 Watts St Haskins, OH 43525
Estimated Value: $154,000 - $247,000
3
Beds
2
Baths
1,700
Sq Ft
$116/Sq Ft
Est. Value
About This Home
This home is located at 204 Watts St, Haskins, OH 43525 and is currently estimated at $197,985, approximately $116 per square foot. 204 Watts St is a home located in Wood County with nearby schools including Otsego Elementary School, Otsego Junior High School, and Otsego High School.
Ownership History
Date
Name
Owned For
Owner Type
Purchase Details
Closed on
Sep 30, 2009
Sold by
Hanna Harold M
Bought by
Chase Christopher K
Current Estimated Value
Home Financials for this Owner
Home Financials are based on the most recent Mortgage that was taken out on this home.
Original Mortgage
$105,102
Outstanding Balance
$69,014
Interest Rate
5.19%
Mortgage Type
New Conventional
Estimated Equity
$128,971
Purchase Details
Closed on
Aug 30, 2005
Sold by
Bethel Matthew C and Bethel Becky A
Bought by
Bloomfield Rosella R
Purchase Details
Closed on
Oct 29, 1997
Sold by
Digby Roger
Bought by
Lange Becky A
Home Financials for this Owner
Home Financials are based on the most recent Mortgage that was taken out on this home.
Original Mortgage
$50,000
Interest Rate
7.95%
Mortgage Type
New Conventional
Purchase Details
Closed on
Jan 27, 1987
Sold by
Dawley Marilyn D
Bought by
Digby James
Create a Home Valuation Report for This Property
The Home Valuation Report is an in-depth analysis detailing your home's value as well as a comparison with similar homes in the area
Home Values in the Area
Average Home Value in this Area
Purchase History
| Date | Buyer | Sale Price | Title Company |
|---|---|---|---|
| Chase Christopher K | $103,000 | Attorney | |
| Bloomfield Rosella R | $115,000 | -- | |
| Lange Becky A | $61,000 | -- | |
| Digby James | -- | -- |
Source: Public Records
Mortgage History
| Date | Status | Borrower | Loan Amount |
|---|---|---|---|
| Open | Chase Christopher K | $105,102 | |
| Previous Owner | Lange Becky A | $50,000 |
Source: Public Records
Tax History Compared to Growth
Tax History
| Year | Tax Paid | Tax Assessment Tax Assessment Total Assessment is a certain percentage of the fair market value that is determined by local assessors to be the total taxable value of land and additions on the property. | Land | Improvement |
|---|---|---|---|---|
| 2024 | $2,014 | $43,925 | $10,815 | $33,110 |
| 2023 | $2,014 | $43,930 | $10,820 | $33,110 |
| 2021 | $1,397 | $36,720 | $9,630 | $27,090 |
| 2020 | $1,403 | $36,720 | $9,630 | $27,090 |
| 2019 | $1,266 | $32,980 | $9,630 | $23,350 |
| 2018 | $1,262 | $32,980 | $9,630 | $23,350 |
| 2017 | $1,041 | $32,980 | $9,630 | $23,350 |
| 2016 | $853 | $26,040 | $9,450 | $16,590 |
| 2015 | $853 | $26,040 | $9,450 | $16,590 |
| 2014 | $878 | $26,040 | $9,450 | $16,590 |
| 2013 | $885 | $24,790 | $9,000 | $15,790 |
Source: Public Records
Map
Nearby Homes
- 0 River Rd W
- 16600 Tyler Rd
- 117 S 5th St
- 22 S 5th St
- 0 W River Rd Unit 6133310
- 0 W River Rd Unit 6134934
- 214 N 2nd St
- 132 Wilkshire Dr
- 13124 Devils Hole Rd
- 341 N River Rd
- 842 Cherry Ln
- 305 Ridgepoint Cir
- 0 King Rd Unit 10000333
- 1371 Eastridge Dr
- 18555 Crom St
- 491 Patriot Dr W
- 28 Mattatuck Way
- 540 Independence Dr
- 792 Wilkshire Dr
- 25216 John F McCarthy Way