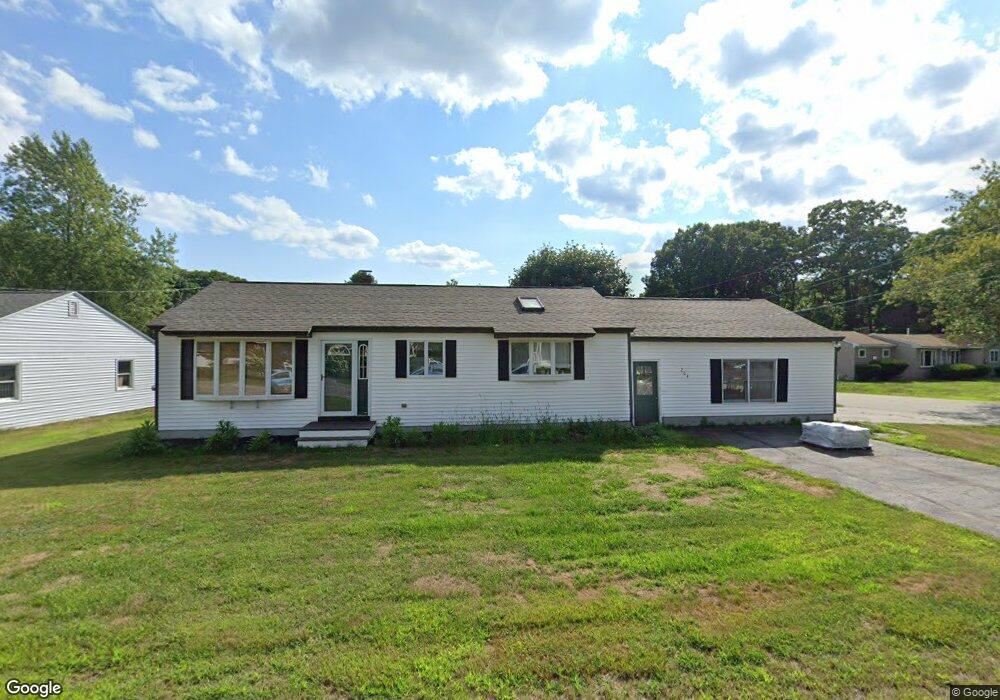
204 West St Biddeford, ME 04005
South Biddeford NeighborhoodEstimated Value: $395,000 - $440,000
2
Beds
1
Bath
1,008
Sq Ft
$414/Sq Ft
Est. Value
About This Home
This home is located at 204 West St, Biddeford, ME 04005 and is currently estimated at $417,761, approximately $414 per square foot. 204 West St is a home located in York County with nearby schools including John F Kennedy Memorial School, Biddeford Primary School, and Biddeford Intermediate School.
Ownership History
Date
Name
Owned For
Owner Type
Purchase Details
Closed on
Feb 14, 2012
Sold by
Mathieu Karen A and Mathieu Kevin R
Bought by
Coker Anthony C
Current Estimated Value
Home Financials for this Owner
Home Financials are based on the most recent Mortgage that was taken out on this home.
Original Mortgage
$176,000
Outstanding Balance
$118,783
Interest Rate
3.96%
Mortgage Type
New Conventional
Estimated Equity
$298,978
Create a Home Valuation Report for This Property
The Home Valuation Report is an in-depth analysis detailing your home's value as well as a comparison with similar homes in the area
Home Values in the Area
Average Home Value in this Area
Purchase History
| Date | Buyer | Sale Price | Title Company |
|---|---|---|---|
| Coker Anthony C | -- | -- |
Source: Public Records
Mortgage History
| Date | Status | Borrower | Loan Amount |
|---|---|---|---|
| Open | Coker Anthony C | $176,000 |
Source: Public Records
Tax History
| Year | Tax Paid | Tax Assessment Tax Assessment Total Assessment is a certain percentage of the fair market value that is determined by local assessors to be the total taxable value of land and additions on the property. | Land | Improvement |
|---|---|---|---|---|
| 2025 | $5,368 | $359,300 | $148,600 | $210,700 |
| 2024 | $5,122 | $360,200 | $148,600 | $211,600 |
| 2023 | $4,690 | $357,500 | $145,900 | $211,600 |
| 2022 | $4,117 | $250,900 | $82,100 | $168,800 |
| 2021 | $3,888 | $213,300 | $69,500 | $143,800 |
| 2020 | $3,916 | $195,300 | $63,200 | $132,100 |
| 2019 | $3,902 | $195,300 | $63,200 | $132,100 |
| 2018 | $3,847 | $195,300 | $63,200 | $132,100 |
| 2017 | $3,566 | $177,700 | $63,200 | $114,500 |
| 2016 | $3,529 | $177,700 | $63,200 | $114,500 |
| 2015 | $3,460 | $177,700 | $63,200 | $114,500 |
| 2014 | $3,375 | $177,700 | $63,200 | $114,500 |
| 2013 | -- | $189,300 | $59,700 | $129,600 |
Source: Public Records
Map
Nearby Homes
Your Personal Tour Guide
Ask me questions while you tour the home.