Estimated Value: $883,000 - $962,000
6
Beds
6
Baths
5,992
Sq Ft
$154/Sq Ft
Est. Value
About This Home
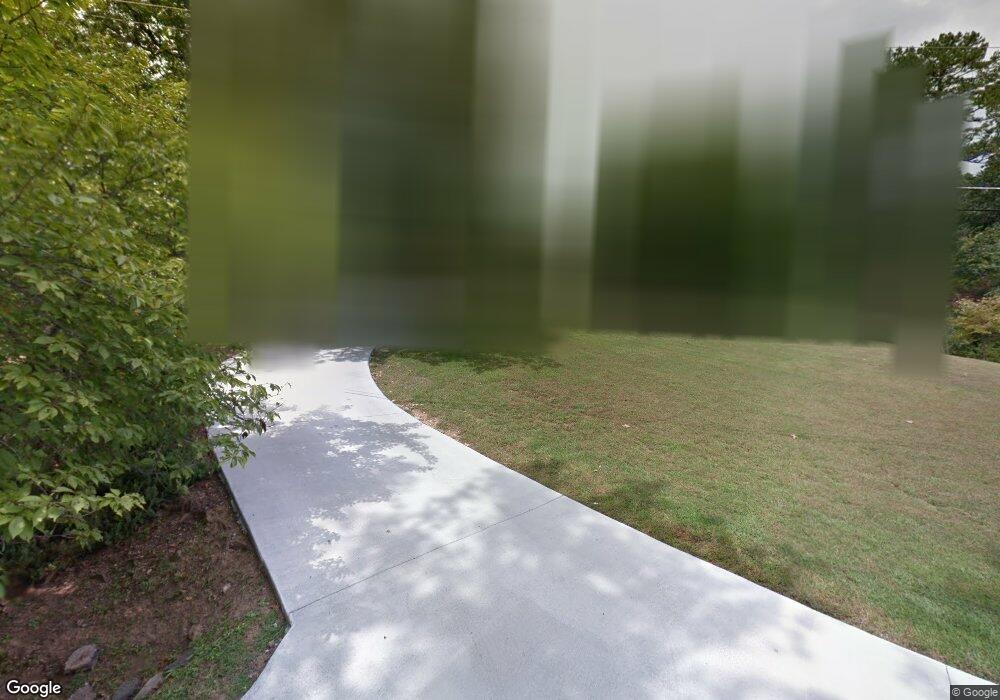
This home is located at 204 Woodglen Rd SW Unit PT. TRACT1, Rome, GA 30165 and is currently estimated at $924,498, approximately $154 per square foot. 204 Woodglen Rd SW Unit PT. TRACT1 is a home located in Floyd County with nearby schools including Dan McCarty Middle School and Rome High School.
Ownership History
Date
Name
Owned For
Owner Type
Purchase Details
Closed on
Aug 13, 2025
Sold by
Greene Perry Clarke
Bought by
Greene Marjorie Taylor Trust
Current Estimated Value
Purchase Details
Closed on
Oct 29, 2020
Sold by
Hurley William B
Bought by
Greene Perry Clarke
Home Financials for this Owner
Home Financials are based on the most recent Mortgage that was taken out on this home.
Original Mortgage
$488,000
Interest Rate
2.8%
Mortgage Type
New Conventional
Purchase Details
Closed on
Sep 19, 2012
Bought by
P and R
Purchase Details
Closed on
Jan 15, 2004
Bought by
P and R
Purchase Details
Closed on
Jan 14, 2004
Bought by
P and R
Purchase Details
Closed on
Jan 12, 2004
Bought by
P and R
Purchase Details
Closed on
Jan 9, 2004
Bought by
P and R
Purchase Details
Closed on
Apr 19, 1963
Sold by
Covington Jim & Co
Bought by
Camp William Lawrence
Purchase Details
Closed on
Jan 2, 1901
Sold by
Horseleg Heights Inc
Bought by
Covington Jim & Co
Purchase Details
Closed on
Jan 1, 1901
Bought by
Horseleg Heights Inc
Create a Home Valuation Report for This Property
The Home Valuation Report is an in-depth analysis detailing your home's value as well as a comparison with similar homes in the area
Home Values in the Area
Average Home Value in this Area
Purchase History
| Date | Buyer | Sale Price | Title Company |
|---|---|---|---|
| Greene Marjorie Taylor Trust | -- | -- | |
| Greene Perry Clarke | $610,000 | -- | |
| P | -- | -- | |
| P | -- | -- | |
| Hurley Hurley P | -- | -- | |
| P | -- | -- | |
| P | -- | -- | |
| P | -- | -- | |
| Camp William Lawrence | $5,000 | -- | |
| Covington Jim & Co | -- | -- | |
| Horseleg Heights Inc | -- | -- |
Source: Public Records
Mortgage History
| Date | Status | Borrower | Loan Amount |
|---|---|---|---|
| Previous Owner | Greene Perry Clarke | $488,000 |
Source: Public Records
Tax History Compared to Growth
Tax History
| Year | Tax Paid | Tax Assessment Tax Assessment Total Assessment is a certain percentage of the fair market value that is determined by local assessors to be the total taxable value of land and additions on the property. | Land | Improvement |
|---|---|---|---|---|
| 2024 | $11,088 | $347,746 | $70,224 | $277,522 |
| 2023 | $10,806 | $334,633 | $63,840 | $270,793 |
| 2022 | $9,804 | $281,533 | $52,349 | $229,184 |
| 2021 | $9,384 | $254,216 | $47,897 | $206,319 |
| 2020 | $8,168 | $240,038 | $41,649 | $198,389 |
| 2019 | $7,934 | $231,111 | $41,649 | $189,462 |
| 2018 | $7,729 | $220,479 | $39,668 | $180,811 |
| 2017 | $7,149 | $194,385 | $36,729 | $157,656 |
| 2016 | $7,089 | $192,196 | $36,720 | $155,476 |
| 2015 | $6,502 | $186,665 | $36,720 | $149,945 |
| 2014 | $6,502 | $186,665 | $36,720 | $149,945 |
Source: Public Records
Map
Nearby Homes
- 17 Crestwood Dr SW
- 20 Pine Valley Rd SW
- 8 Crestwood Dr SW
- 7 Pine Valley Rd SW
- 0 Featherston Rd SW Unit 13890394
- 0 Featherston Rd SW Unit 10512723
- 11 Brow Rd SW
- 0 Hidden Ridge Dr Unit 10343694
- 0 Hidden Ridge Dr Unit 10343706
- 0 Hidden Ridge Dr Unit 10343701
- 0 Hidden Ridge Dr Unit 10343693
- 0 Hidden Ridge Dr Unit 10343685
- 0 Hidden Ridge Dr Unit 10556470
- 0 Hidden Ridge Dr Unit 10343688
- 0 Hidden Ridge Dr Unit 10343680
- 0 Hidden Ridge Dr Unit 10343696
- 0 Hidden Ridge Dr Unit 10343689
- 0 Hidden Ridge Dr Unit 10343700
- 0 Hidden Ridge Dr Unit 10343676
- 28 Mountain Crest Dr SW
- 204 Woodglen Rd SW
- 203 Woodglen Rd SW
- 30 Pine Valley Rd SW
- 1 Hilldale Ln SW
- 28 Pine Valley Rd SW
- 15 Woodglen Rd SW
- 219 Green View Rd SW
- 201 Woodglen Rd SW
- 221 Green View Rd SW
- 215 Green View Rd SW
- 223 Green View Rd SW
- 27 Pine Valley Rd SW
- 29 Pine Valley Rd SW
- 31 Pine Valley Rd SW
- 210 Green View Rd SW
- 4 Hilldale Ln SW
- 25 Pine Valley Rd SW Unit 42
- 25 Pine Valley Rd SW
- 212 Green View Rd SW
- 26 Pine Valley Rd SW