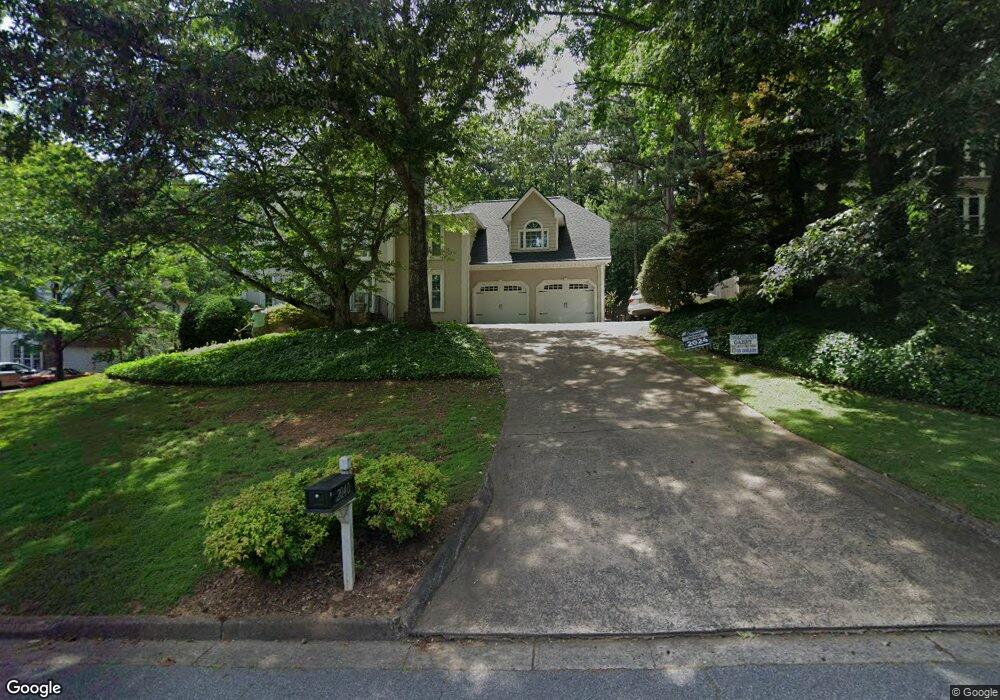
2040 Bridle Ridge Trace Roswell, GA 30075
Estimated Value: $638,000 - $712,322
4
Beds
3
Baths
2,826
Sq Ft
$238/Sq Ft
Est. Value
About This Home
This home is located at 2040 Bridle Ridge Trace, Roswell, GA 30075 and is currently estimated at $671,331, approximately $237 per square foot. 2040 Bridle Ridge Trace is a home located in Fulton County with nearby schools including Mountain Park Elementary School, Crabapple Middle School, and Roswell High School.
Ownership History
Date
Name
Owned For
Owner Type
Purchase Details
Closed on
Feb 14, 2021
Sold by
Leder Sam Lewis
Bought by
Pressnall Samantha Leder
Current Estimated Value
Purchase Details
Closed on
Apr 26, 2010
Sold by
Carr David G and Carr Shellie
Bought by
Leder Sam and Leder Joann
Purchase Details
Closed on
Nov 21, 2006
Sold by
Carr David G
Bought by
Carr David G and Carr Shellie
Home Financials for this Owner
Home Financials are based on the most recent Mortgage that was taken out on this home.
Original Mortgage
$266,800
Interest Rate
6.25%
Mortgage Type
New Conventional
Purchase Details
Closed on
Mar 20, 1998
Sold by
Caswell Deborah S
Bought by
Marvin Guy E and Marvin Sindy
Home Financials for this Owner
Home Financials are based on the most recent Mortgage that was taken out on this home.
Original Mortgage
$179,900
Interest Rate
7.01%
Mortgage Type
New Conventional
Create a Home Valuation Report for This Property
The Home Valuation Report is an in-depth analysis detailing your home's value as well as a comparison with similar homes in the area
Home Values in the Area
Average Home Value in this Area
Purchase History
| Date | Buyer | Sale Price | Title Company |
|---|---|---|---|
| Pressnall Samantha Leder | -- | -- | |
| Pressnall Samantha Leder | -- | -- | |
| Leder Sam | $257,000 | -- | |
| Carr David G | -- | -- | |
| Carr David G | $333,500 | -- | |
| Marvin Guy E | $209,900 | -- |
Source: Public Records
Mortgage History
| Date | Status | Borrower | Loan Amount |
|---|---|---|---|
| Previous Owner | Carr David G | $266,800 | |
| Previous Owner | Marvin Guy E | $179,900 |
Source: Public Records
Tax History Compared to Growth
Tax History
| Year | Tax Paid | Tax Assessment Tax Assessment Total Assessment is a certain percentage of the fair market value that is determined by local assessors to be the total taxable value of land and additions on the property. | Land | Improvement |
|---|---|---|---|---|
| 2025 | $851 | $246,400 | $68,120 | $178,280 |
| 2023 | $6,215 | $220,200 | $44,440 | $175,760 |
| 2022 | $3,619 | $177,840 | $34,800 | $143,040 |
| 2021 | $4,744 | $148,960 | $28,400 | $120,560 |
| 2020 | $4,700 | $143,520 | $37,760 | $105,760 |
| 2019 | $698 | $140,960 | $37,080 | $103,880 |
| 2018 | $3,617 | $128,160 | $36,240 | $91,920 |
| 2017 | $3,596 | $123,240 | $34,840 | $88,400 |
| 2016 | $3,597 | $123,240 | $34,840 | $88,400 |
| 2015 | $4,283 | $123,240 | $34,840 | $88,400 |
| 2014 | $3,130 | $102,120 | $31,800 | $70,320 |
Source: Public Records
Map
Nearby Homes
- 2000 Trotters Ridge Way Unit 2B
- 4973 Gunners Pass NE
- 4383 Capstone Ct NE
- 11790 Highland Colony Dr
- 1945 Ledieu Rd
- 1820 Azalea Springs Trail
- 11775 Highland Colony Dr Unit 1
- 235 Foxley Way
- 4304 Lindsey Way NE
- 715 Winterwind Way
- 11675 Highland Colony Dr Unit 1
- 150 Flowing Spring Trail Unit 4
- 230 Moss Stone Way Unit 2
- 5023 Gunners Run NE
- 475 Laurian View Ct
- 12180 Lonsdale Ln
- 123 Ivey Way
- 2050 Bridle Ridge Trace
- 2030 Bridle Ridge Trace
- 2060 Bridle Ridge Trace
- 2020 Bridle Ridge Trace
- 2020 Bridle Ridge Trace Unit 2B
- 4944 Old Mountain Park Rd NE
- 1995 Bridle Ridge Trace
- 1985 Trotters Ridge Way
- 2010 Bridle Ridge Trace
- 2005 Bridle Ridge Trace
- 1990 Trotters Ridge Way
- 4950 Surrey Dr
- 4960 Surrey Dr
- 1965 Bridle Ridge Trace Unit 2B
- 4972 Gunners Run NE Unit 1
- 4970 Surrey Dr
- 2015 Bridle Ridge Trace
- 4940 Surrey Dr Unit 1
- 2000 Bridle Ridge Trace
- 1995 Trotters Ridge Way