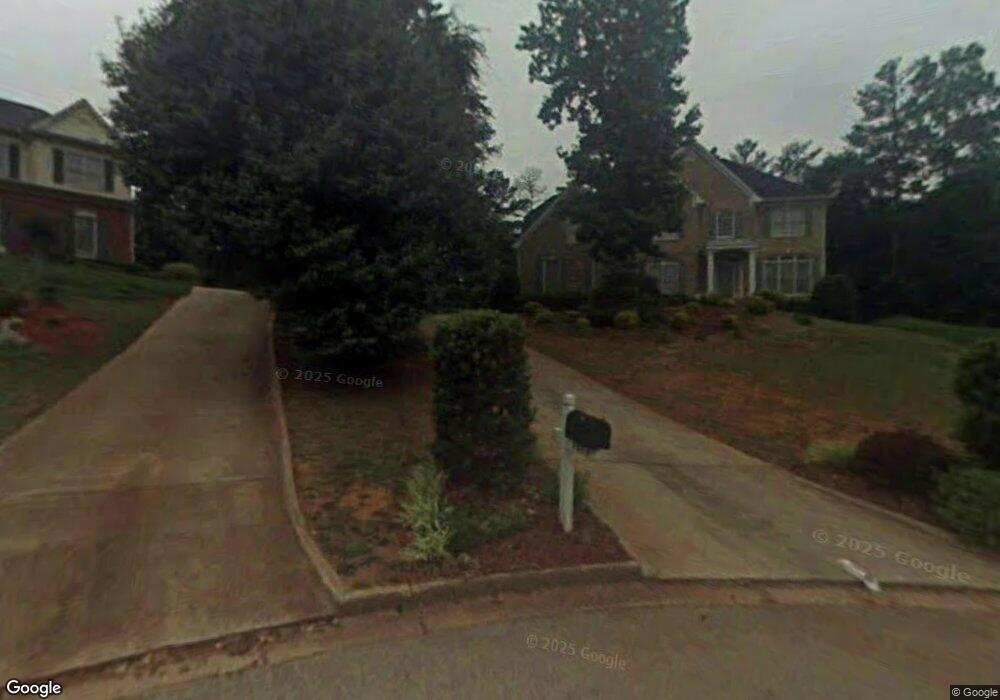
2040 Oak Brooks Unit XIX Jonesboro, GA 30236
Estimated Value: $345,000 - $373,000
5
Beds
3
Baths
2,662
Sq Ft
$134/Sq Ft
Est. Value
About This Home
This home is located at 2040 Oak Brooks Unit XIX, Jonesboro, GA 30236 and is currently estimated at $356,943, approximately $134 per square foot. 2040 Oak Brooks Unit XIX is a home located in Clayton County with nearby schools including Suder Elementary School, M. D. Roberts Middle School, and Jonesboro High School.
Ownership History
Date
Name
Owned For
Owner Type
Purchase Details
Closed on
Jan 4, 2024
Sold by
Glover Thomas
Bought by
Tuggle Michael
Current Estimated Value
Purchase Details
Closed on
Aug 12, 2010
Sold by
Glover Gletra C
Bought by
Glover Thomas
Purchase Details
Closed on
Aug 14, 2009
Sold by
Glover Thomas R
Bought by
Glover Thomas R and Ferrell-Glover Janet
Purchase Details
Closed on
Apr 30, 1998
Sold by
John Wieland Homes & Neighborhoo
Bought by
Glover Thomas R and Glover Gierta
Home Financials for this Owner
Home Financials are based on the most recent Mortgage that was taken out on this home.
Original Mortgage
$195,660
Interest Rate
7.02%
Mortgage Type
New Conventional
Create a Home Valuation Report for This Property
The Home Valuation Report is an in-depth analysis detailing your home's value as well as a comparison with similar homes in the area
Home Values in the Area
Average Home Value in this Area
Purchase History
| Date | Buyer | Sale Price | Title Company |
|---|---|---|---|
| Tuggle Michael | -- | -- | |
| Glover Thomas | -- | -- | |
| Glover Thomas R | -- | -- | |
| Glover Thomas R | -- | -- | |
| Glover Thomas R | $206,000 | -- |
Source: Public Records
Mortgage History
| Date | Status | Borrower | Loan Amount |
|---|---|---|---|
| Previous Owner | Glover Thomas R | $195,660 | |
| Previous Owner | Glover Thomas R | $229,500 |
Source: Public Records
Tax History Compared to Growth
Tax History
| Year | Tax Paid | Tax Assessment Tax Assessment Total Assessment is a certain percentage of the fair market value that is determined by local assessors to be the total taxable value of land and additions on the property. | Land | Improvement |
|---|---|---|---|---|
| 2024 | $5,345 | $146,040 | $9,600 | $136,440 |
| 2023 | $5,056 | $140,040 | $9,600 | $130,440 |
| 2022 | $4,434 | $122,000 | $9,600 | $112,400 |
| 2021 | $3,074 | $86,880 | $9,600 | $77,280 |
| 2020 | $3,061 | $85,580 | $9,600 | $75,980 |
| 2019 | $2,992 | $82,776 | $9,600 | $73,176 |
| 2018 | $2,771 | $77,334 | $9,600 | $67,734 |
| 2017 | $2,392 | $67,843 | $9,600 | $58,243 |
| 2016 | $2,289 | $65,311 | $9,600 | $55,711 |
| 2015 | $2,139 | $0 | $0 | $0 |
| 2014 | $1,622 | $49,811 | $9,600 | $40,211 |
Source: Public Records
Map
Nearby Homes
- 9510 Creekside Rd
- 1720 Byrom Pkwy Unit 2
- 1935 Watercrest Dr
- 9419 Rocky Creek
- 2106 Fair Ridge Ct
- 9396 Fairfield Pkwy
- 2105 Fair Ridge Ct
- 1814 Deer Crossing Way
- 9361 Arbor Glen Ct Unit 13
- 1770 Deer Crossing Cir
- 1879 Lake Chase Ln
- 9342 Carillon Ct
- 9260 Betony Wood Trail
- 9243 Seminole Rd
- 9492 Deer Crossing Trace
- 9780 Dixon Industrial Blvd
- 9307 Glenleigh Way
- 9806 Dixon Industrial Blvd
- 0 Turner Rd Unit 20172270
- 0 Turner Rd Unit 20172265
- 2046 Oak Brooks Unit XIX
- 2041 Oak Brooks
- 1906 Flatrock Ct
- 1910 Flatrock Ct
- 1899 River Way
- 1907 River Way
- 1907 River Way Unit 2/88
- 1907 River Way Unit 2
- 2059 Rosemont Terrace
- 2054 Oak Brooks
- 2049 Oak Brooks
- 2049 Oak Brooks Unit 35D
- 1891 River Way Unit 2
- 2049 Rosemont Terrace
- 0 Oak Brook Unit 7047955
- 2090 Oak Brook
- 9516 Byrom Rd
- 9510 Byrom Rd Unit 2
- 2089 Rosemont Ct
- 2057 Oak Brooks