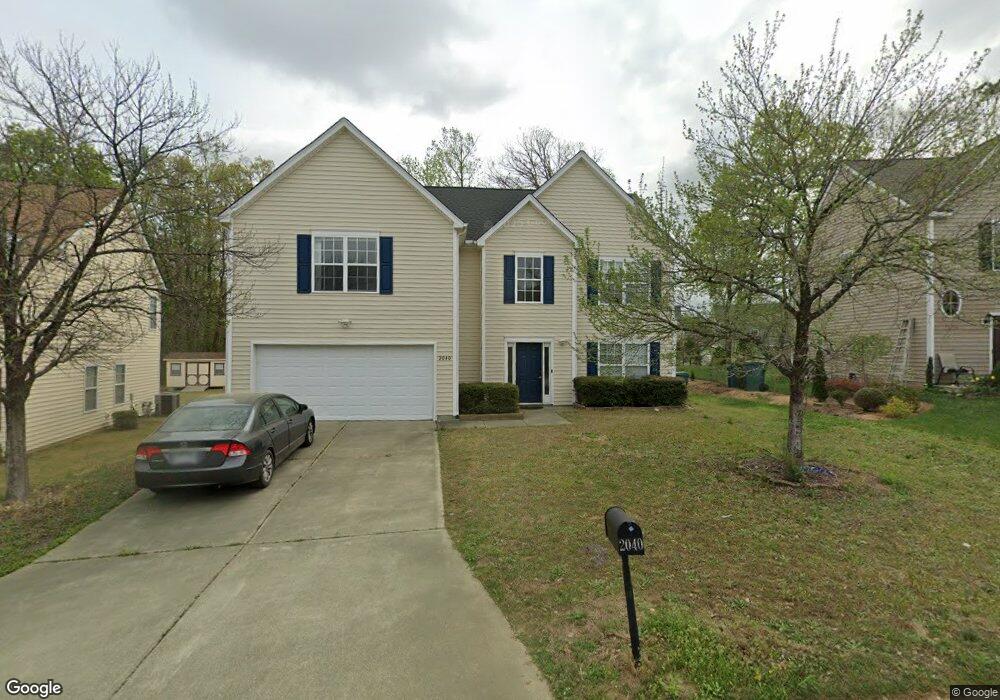
2040 Spring Creek Dr Durham, NC 27704
Northeast Durham NeighborhoodEstimated Value: $368,000 - $406,000
4
Beds
3
Baths
2,430
Sq Ft
$159/Sq Ft
Est. Value
About This Home
This home is located at 2040 Spring Creek Dr, Durham, NC 27704 and is currently estimated at $386,205, approximately $158 per square foot. 2040 Spring Creek Dr is a home located in Durham County with nearby schools including Merrick-Moore Elementary School, John W Neal Middle School, and Southern School of Energy & Sustainability.
Ownership History
Date
Name
Owned For
Owner Type
Purchase Details
Closed on
Sep 9, 2020
Sold by
Melton Jameia W and Melton Carmella D
Bought by
Pham Michael T
Current Estimated Value
Home Financials for this Owner
Home Financials are based on the most recent Mortgage that was taken out on this home.
Original Mortgage
$190,000
Outstanding Balance
$168,612
Interest Rate
2.9%
Mortgage Type
New Conventional
Estimated Equity
$217,593
Purchase Details
Closed on
May 29, 2007
Sold by
Homelife Communities Of Raleigh Inc
Bought by
Melton Jameia W and Melton Carmella D
Home Financials for this Owner
Home Financials are based on the most recent Mortgage that was taken out on this home.
Original Mortgage
$185,388
Interest Rate
6.17%
Mortgage Type
Purchase Money Mortgage
Create a Home Valuation Report for This Property
The Home Valuation Report is an in-depth analysis detailing your home's value as well as a comparison with similar homes in the area
Home Values in the Area
Average Home Value in this Area
Purchase History
| Date | Buyer | Sale Price | Title Company |
|---|---|---|---|
| Pham Michael T | $260,000 | None Available | |
| Melton Jameia W | $185,500 | None Available |
Source: Public Records
Mortgage History
| Date | Status | Borrower | Loan Amount |
|---|---|---|---|
| Open | Pham Michael T | $190,000 | |
| Previous Owner | Melton Jameia W | $185,388 |
Source: Public Records
Tax History Compared to Growth
Tax History
| Year | Tax Paid | Tax Assessment Tax Assessment Total Assessment is a certain percentage of the fair market value that is determined by local assessors to be the total taxable value of land and additions on the property. | Land | Improvement |
|---|---|---|---|---|
| 2025 | $2,882 | $428,578 | $80,625 | $347,953 |
| 2024 | $2,882 | $206,594 | $25,780 | $180,814 |
| 2023 | $2,706 | $206,594 | $25,780 | $180,814 |
| 2022 | $2,644 | $206,594 | $25,780 | $180,814 |
| 2021 | $2,632 | $206,594 | $25,780 | $180,814 |
| 2020 | $2,570 | $206,594 | $25,780 | $180,814 |
| 2019 | $2,570 | $206,594 | $25,780 | $180,814 |
| 2018 | $2,406 | $177,384 | $29,002 | $148,382 |
| 2017 | $2,388 | $177,384 | $29,002 | $148,382 |
| 2016 | $2,308 | $177,384 | $29,002 | $148,382 |
| 2015 | $2,908 | $210,076 | $34,373 | $175,703 |
| 2014 | $2,908 | $210,076 | $34,373 | $175,703 |
Source: Public Records
Map
Nearby Homes
- 2238 Crestwood Ridge Dr
- 1012 Ringhill Bluff Dr
- 2121 Lime St
- 1615 Great Bend Dr
- 2027 Buffalo Way
- 2206 E Club Blvd
- 18 Syracuse Place
- 1515 Milan St
- 1509 Logan St
- 1519 Milan St
- 1821 E Geer St
- 1823 E Geer St
- 1720 Glenn School Rd
- 2321 Overland Dr
- 5 Sue Ann Ct
- 2013 Rabbitbrush St
- 2210 Rabbitbrush St
- 2212 Rabbitbrush St
- 2206 Rabbitbrush St
- 2214 Rabbitbrush St
- 2038 Spring Creek Dr
- 2042 Spring Creek Dr
- 2044 Spring Creek Dr
- 2036 Spring Creek Dr
- 2242 Crestwood Ridge Dr
- 2246 Crestwood Ridge Dr
- 2234 Crestwood Ridge Dr
- 2300 Crestwood Ridge Dr
- 2039 Spring Creek Dr
- 2037 Spring Creek Dr
- 2046 Spring Creek Dr
- 2034 Spring Creek Dr
- 2043 Spring Creek Dr
- 2304 Crestwood Ridge Dr
- 2035 Spring Creek Dr
- 2032 Spring Creek Dr
- 2048 Spring Creek Dr
- 2047 Spring Creek Dr
- 2033 Spring Creek Dr
- 2308 Crestwood Ridge Dr