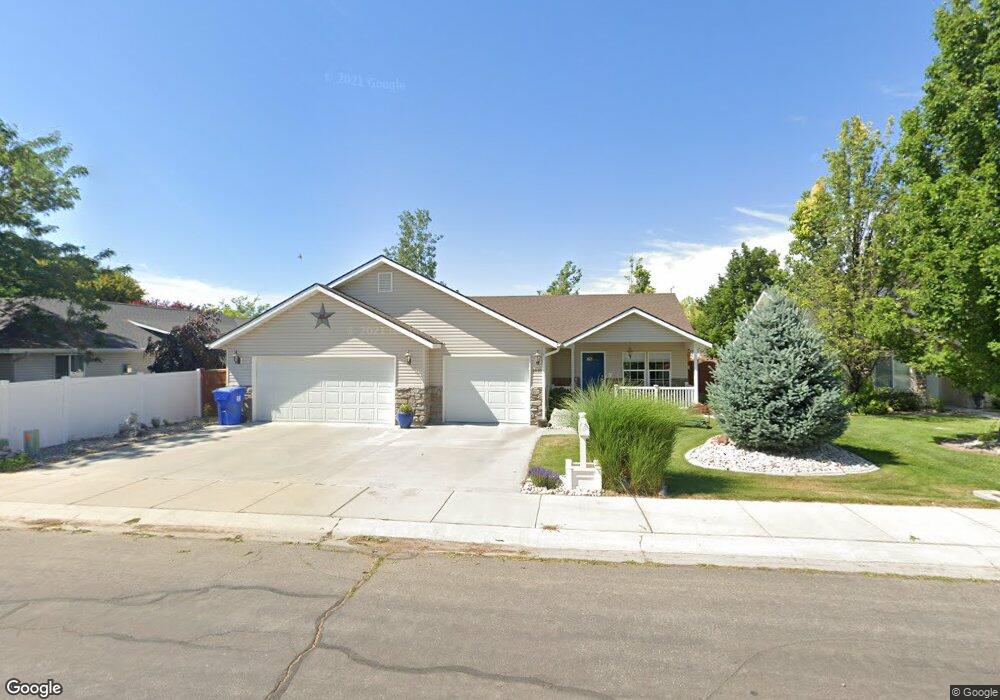
2040 Talus Loop Twin Falls, ID 83301
Estimated Value: $368,188 - $408,000
3
Beds
2
Baths
1,467
Sq Ft
$269/Sq Ft
Est. Value
About This Home
This home is located at 2040 Talus Loop, Twin Falls, ID 83301 and is currently estimated at $395,047, approximately $269 per square foot. 2040 Talus Loop is a home located in Twin Falls County with nearby schools including Rock Creek Elementary School, Robert Stuart Junior High School, and Canyon Ridge High School.
Ownership History
Date
Name
Owned For
Owner Type
Purchase Details
Closed on
Aug 16, 2007
Sold by
Anderson Joy R
Bought by
Mchenry Kim R and Mchenry Gail M
Current Estimated Value
Home Financials for this Owner
Home Financials are based on the most recent Mortgage that was taken out on this home.
Original Mortgage
$68,000
Interest Rate
6.62%
Mortgage Type
New Conventional
Purchase Details
Closed on
Dec 14, 2005
Sold by
Mooris John J
Bought by
Anderson Joy R
Home Financials for this Owner
Home Financials are based on the most recent Mortgage that was taken out on this home.
Original Mortgage
$131,920
Interest Rate
5.67%
Mortgage Type
New Conventional
Purchase Details
Closed on
Oct 18, 2005
Sold by
Wideman Mark and Wideman Tammy
Bought by
Morris John J and Anderson Joy R
Home Financials for this Owner
Home Financials are based on the most recent Mortgage that was taken out on this home.
Original Mortgage
$131,920
Interest Rate
5.67%
Mortgage Type
New Conventional
Create a Home Valuation Report for This Property
The Home Valuation Report is an in-depth analysis detailing your home's value as well as a comparison with similar homes in the area
Purchase History
| Date | Buyer | Sale Price | Title Company |
|---|---|---|---|
| Mchenry Kim R | -- | None Available | |
| Anderson Joy R | -- | -- | |
| Morris John J | -- | -- |
Source: Public Records
Mortgage History
| Date | Status | Borrower | Loan Amount |
|---|---|---|---|
| Closed | Mchenry Kim R | $68,000 | |
| Previous Owner | Morris John J | $131,920 |
Source: Public Records
Tax History
| Year | Tax Paid | Tax Assessment Tax Assessment Total Assessment is a certain percentage of the fair market value that is determined by local assessors to be the total taxable value of land and additions on the property. | Land | Improvement |
|---|---|---|---|---|
| 2025 | $1,816 | $315,429 | $63,040 | $252,389 |
| 2024 | $1,799 | $315,429 | $63,040 | $252,389 |
| 2023 | $1,706 | $331,402 | $63,040 | $268,362 |
| 2022 | $2,515 | $344,634 | $65,092 | $279,542 |
| 2021 | $2,130 | $266,450 | $59,841 | $206,609 |
| 2020 | $2,010 | $231,726 | $59,841 | $171,885 |
| 2019 | $2,160 | $220,903 | $55,171 | $165,732 |
| 2018 | $2,076 | $210,851 | $39,648 | $171,203 |
| 2017 | $1,826 | $194,849 | $39,648 | $155,201 |
| 2016 | $1,711 | $170,678 | $0 | $0 |
| 2015 | $1,664 | $170,678 | $39,648 | $131,030 |
| 2012 | -- | $145,355 | $0 | $0 |
Source: Public Records
Map
Nearby Homes
- 381 Federation Rd
- 420 Shadetree Trail
- 455 Coiner Cir
- 330 Arrowhead Path
- 525 Shadetree Trail
- 132 Los Lagos
- 2221 Canyon Trail Way
- 513 Falling Leaf Ln
- 2230 Stricker Place
- 521 Falling Leaf Ln
- 542 Falling Leaf Ln
- 527 Falling Leaf Ln
- 548 Falling Leaf Ln
- 2264 Detweiler Place
- 215 Los Lagos
- 222 Avenida Del Rio Dr
- 2043 Prospector Way
- 1897 Hampton Way
- 1935 Hampton Way
- 2054 Red Rock Way
- 2032 Talus Loop
- 2032 Talus Loop Unit na
- 2028 Canyon Trail Way
- 341 Shadetree Trail
- 2054 Canyon Trail Way
- 2028 Talus Loop
- 2043 Talus Loop
- 2033 Talus Loop
- 2019 Canyon Trail Way
- 2031 Canyon Trail Way
- 2009 Canyon Trail Way
- 2022 Talus Loop
- 1997 Canyon Trail Way
- 1994 Canyon Trail Way
- 1995 Talus Loop
- 2053 Canyon Trail Way
- 1997 Canyon Trail Way
- 2018 Talus Loop
- 2006 Talus Loop
- 307 Shadetree Trail
Your Personal Tour Guide
Ask me questions while you tour the home.