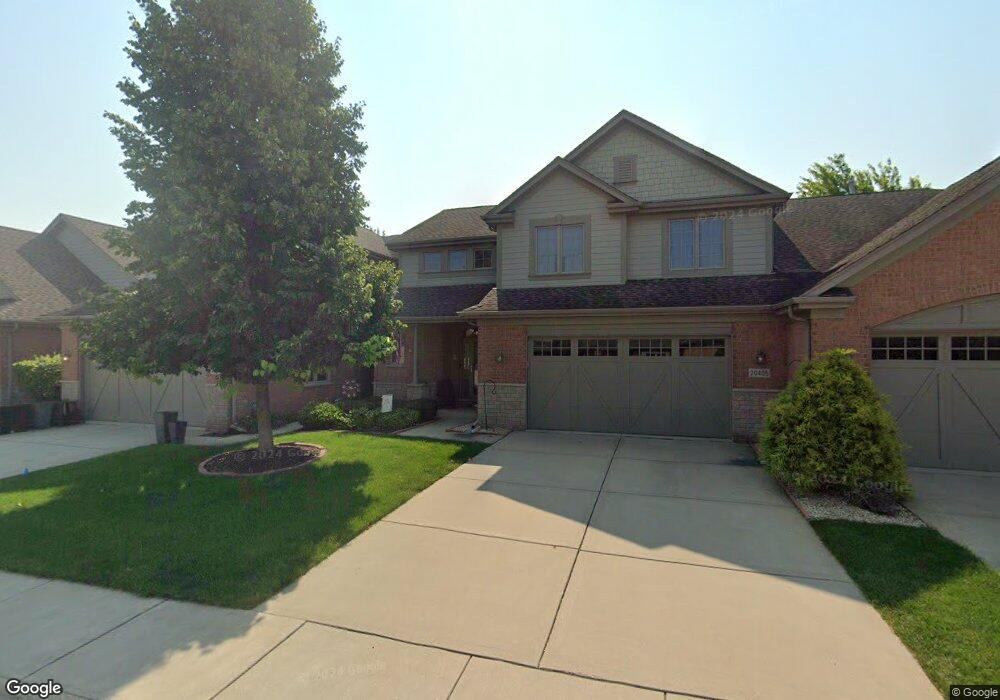
20405 Mackinac Point Dr Unit 7-2 Frankfort, IL 60423
North Frankfort NeighborhoodEstimated Value: $518,000 - $624,000
3
Beds
3
Baths
2,400
Sq Ft
$239/Sq Ft
Est. Value
About This Home
This home is located at 20405 Mackinac Point Dr Unit 7-2, Frankfort, IL 60423 and is currently estimated at $573,668, approximately $239 per square foot. 20405 Mackinac Point Dr Unit 7-2 is a home located in Will County with nearby schools including Indian Trail Elementary School, Summit Hill Junior High School, and Lincoln-Way East High School.
Ownership History
Date
Name
Owned For
Owner Type
Purchase Details
Closed on
Mar 14, 2014
Sold by
Meidell James S and Meidell Kristin S
Bought by
Neil John S and Neil Victoria A
Current Estimated Value
Home Financials for this Owner
Home Financials are based on the most recent Mortgage that was taken out on this home.
Original Mortgage
$275,500
Outstanding Balance
$208,023
Interest Rate
4.24%
Mortgage Type
New Conventional
Estimated Equity
$365,645
Purchase Details
Closed on
Jun 7, 2011
Sold by
Lighthouse Point Llc
Bought by
Meidell James S and Meidell Kristin S
Home Financials for this Owner
Home Financials are based on the most recent Mortgage that was taken out on this home.
Original Mortgage
$233,600
Interest Rate
4.67%
Mortgage Type
New Conventional
Purchase Details
Closed on
Sep 15, 2006
Sold by
Mcenery William J
Bought by
Lighthouse Point Llc
Create a Home Valuation Report for This Property
The Home Valuation Report is an in-depth analysis detailing your home's value as well as a comparison with similar homes in the area
Home Values in the Area
Average Home Value in this Area
Purchase History
| Date | Buyer | Sale Price | Title Company |
|---|---|---|---|
| Neil John S | $290,000 | Fidelity National Title | |
| Meidell James S | $292,000 | Greater Illinois Title Co | |
| Lighthouse Point Llc | $4,255,000 | None Available |
Source: Public Records
Mortgage History
| Date | Status | Borrower | Loan Amount |
|---|---|---|---|
| Open | Neil John S | $275,500 | |
| Previous Owner | Meidell James S | $233,600 |
Source: Public Records
Tax History Compared to Growth
Tax History
| Year | Tax Paid | Tax Assessment Tax Assessment Total Assessment is a certain percentage of the fair market value that is determined by local assessors to be the total taxable value of land and additions on the property. | Land | Improvement |
|---|---|---|---|---|
| 2024 | $14,433 | $173,283 | $780 | $172,503 |
| 2023 | $14,433 | $154,759 | $697 | $154,062 |
| 2022 | $12,763 | $140,959 | $635 | $140,324 |
| 2021 | $11,988 | $131,873 | $594 | $131,279 |
| 2020 | $11,803 | $128,156 | $577 | $127,579 |
| 2019 | $11,416 | $124,726 | $562 | $124,164 |
| 2018 | $10,942 | $120,482 | $546 | $119,936 |
| 2017 | $10,714 | $117,669 | $533 | $117,136 |
| 2016 | $10,508 | $114,893 | $515 | $114,378 |
| 2015 | $8,830 | $97,343 | $497 | $96,846 |
| 2014 | $8,830 | $110,077 | $494 | $109,583 |
| 2013 | $8,830 | $96,165 | $2,957 | $93,208 |
Source: Public Records
Map
Nearby Homes
- 20373 Mackinac Point Dr Unit 62
- 20399 Grosse Point Dr Unit 123
- 20375 Grosse Point Dr Unit 102
- 8839 Indiana Harbor Dr
- 20408 Fallingwater Cir
- 8855 Milwaukee Breakwater Dr
- 8884 Port Washington Dr
- 8964 Port Washington Dr
- 9004 Port Washington Dr
- 20328 Taliesin Way
- 24455 S 88th Ave
- 8679 Cullen Dr
- 20665 Grand Haven Dr
- 8510 W Saint Francis Rd
- 20277 Brendan St
- 20530 Torrey Ct
- 20644 Grand Haven Dr
- 20187 Waterview Trail
- 8310 Auburn Ln
- 20042 Brendan St
- 20405 Mackinac Point Dr
- 20397 Mackinac Point Dr
- 20397 Mackinac Point Dr Unit 7-3
- 20413 Mackinac Point Dr Unit 20413
- 20413 Mackinac Point Dr Unit 342
- 20413 Mackinac Point Dr Unit 71
- 20389 Mackinac Point Dr
- 20389 Mackinac Point Dr Unit 7-4
- 20398 Grosse Point Dr Unit 82
- 20404 Grosse Point Dr Unit 81
- 20394 Grosse Point Dr Unit 83
- 20392 Mackinac Point Dr Unit 22
- 20381 Mackinac Point Dr Unit 61
- 20384 Mackinac Point Dr Unit 23
- 20386 Grosse Point Dr Unit 91
- 20380 Grosse Point Dr Unit 92
- 20374 Grosse Point Dr Unit 93
- 20376 Mackinac Point Dr Unit 3-1
- 20365 Mackinac Point Dr Unit 73
- 20365 Mackinac Point Dr Unit 63