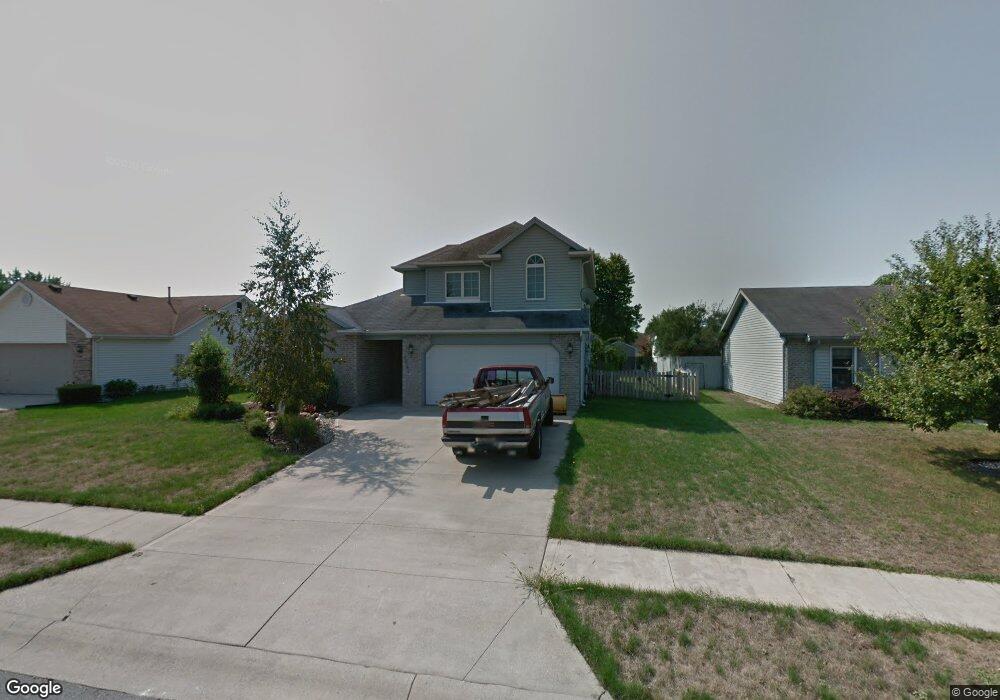
2041 Duncan Dr Huntington, IN 46750
Estimated Value: $231,000 - $265,000
3
Beds
3
Baths
1,441
Sq Ft
$168/Sq Ft
Est. Value
About This Home
This home is located at 2041 Duncan Dr, Huntington, IN 46750 and is currently estimated at $242,499, approximately $168 per square foot. 2041 Duncan Dr is a home located in Huntington County with nearby schools including Lancaster Elementary School, Riverview Middle School, and Huntington North High School.
Ownership History
Date
Name
Owned For
Owner Type
Purchase Details
Closed on
Jul 9, 2010
Sold by
Day Chad
Bought by
Ellis David W
Current Estimated Value
Purchase Details
Closed on
Jul 21, 2009
Sold by
Hall Richard M
Bought by
Day Chad and Parish Morgan
Home Financials for this Owner
Home Financials are based on the most recent Mortgage that was taken out on this home.
Original Mortgage
$92,320
Interest Rate
6.12%
Mortgage Type
Adjustable Rate Mortgage/ARM
Purchase Details
Closed on
Dec 5, 2005
Sold by
Hall Michael J
Bought by
Hall Richard M
Home Financials for this Owner
Home Financials are based on the most recent Mortgage that was taken out on this home.
Original Mortgage
$78,500
Interest Rate
6.17%
Mortgage Type
New Conventional
Create a Home Valuation Report for This Property
The Home Valuation Report is an in-depth analysis detailing your home's value as well as a comparison with similar homes in the area
Home Values in the Area
Average Home Value in this Area
Purchase History
| Date | Buyer | Sale Price | Title Company |
|---|---|---|---|
| Ellis David W | $120,000 | -- | |
| Day Chad | $115,400 | Jones Abstract | |
| Day Chad | -- | None Available | |
| Hall Richard M | -- | None Available |
Source: Public Records
Mortgage History
| Date | Status | Borrower | Loan Amount |
|---|---|---|---|
| Previous Owner | Day Chad | $92,320 | |
| Previous Owner | Hall Richard M | $78,500 |
Source: Public Records
Tax History Compared to Growth
Tax History
| Year | Tax Paid | Tax Assessment Tax Assessment Total Assessment is a certain percentage of the fair market value that is determined by local assessors to be the total taxable value of land and additions on the property. | Land | Improvement |
|---|---|---|---|---|
| 2024 | $1,985 | $198,500 | $18,500 | $180,000 |
| 2023 | $1,673 | $167,300 | $18,500 | $148,800 |
| 2022 | $1,614 | $161,400 | $18,500 | $142,900 |
| 2021 | $1,400 | $140,000 | $18,500 | $121,500 |
| 2020 | $1,230 | $123,000 | $18,500 | $104,500 |
| 2019 | $1,230 | $123,000 | $18,500 | $104,500 |
| 2018 | $1,230 | $123,000 | $18,500 | $104,500 |
| 2017 | $1,249 | $124,900 | $18,500 | $106,400 |
| 2016 | $1,248 | $123,300 | $18,500 | $104,800 |
| 2014 | $1,121 | $112,100 | $18,500 | $93,600 |
| 2013 | $1,121 | $115,300 | $18,500 | $96,800 |
Source: Public Records
Map
Nearby Homes
- 2035 Willow Bend
- 2079 Willow Bend
- 1945 Bedford Ct
- 8 Turquoise St
- 8 Topaz Dr
- tbd Cottage Ave
- 18 Shamrock Ct
- 3515 W 200 N
- 1259 Dearborn St
- 1242 Dearborn St
- 1101 W Joe St
- 2063 Archangel
- 1535 Henry St
- 1365 Edna St
- 1236 Ogan Ave
- 1421 Charles St
- 2090 Chief Turtle Ct
- 1102 Drover St
- 525 Hasty St
- 1239 Lucas Ct
- 2039 Duncan Dr
- 2043 Duncan Dr
- 2031 Stoney Hurst Bend
- 2029 Stoney Hurst Bend
- 2033 Stoney Hurst Bend
- 2037 Duncan Dr
- 2040 Duncan Dr
- 2038 Duncan Dr
- 1963 Bedford Ct
- 2027 Stoney Hurst Bend
- 2042 Duncan Dr
- 2036 Duncan Dr
- 2025 Stoney Hurst Bend
- 2044 Duncan Dr
- 2039 Willow Bend
- 2037 Willow Bend
- 2018 Stoney Hurst Bend
- 2041 Willow Bend
- 2016 Stoney Hurst Bend