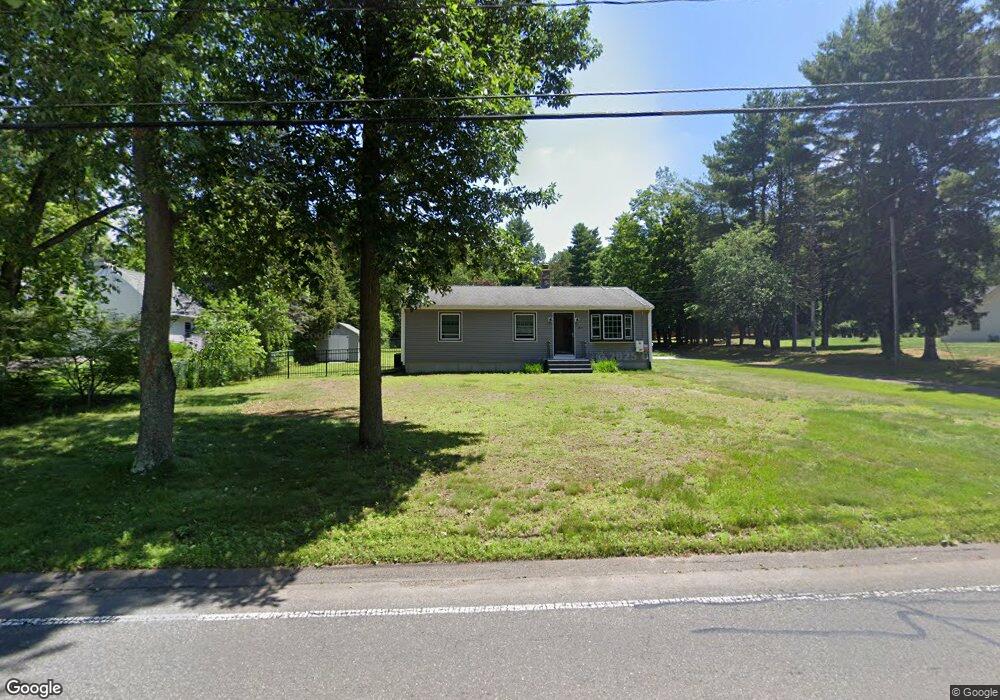
2041 Parker St Springfield, MA 01128
Sixteen Acres NeighborhoodEstimated Value: $301,632 - $333,000
2
Beds
1
Bath
1,080
Sq Ft
$291/Sq Ft
Est. Value
About This Home
This home is located at 2041 Parker St, Springfield, MA 01128 and is currently estimated at $314,408, approximately $291 per square foot. 2041 Parker St is a home located in Hampden County with nearby schools including Daniel B Brunton, M Marcus Kiley Middle, and Springfield High School of Science and Technology.
Ownership History
Date
Name
Owned For
Owner Type
Purchase Details
Closed on
Oct 7, 2008
Sold by
Anthony Susan Ann
Bought by
Marchese John P
Current Estimated Value
Home Financials for this Owner
Home Financials are based on the most recent Mortgage that was taken out on this home.
Original Mortgage
$166,961
Interest Rate
6.54%
Mortgage Type
Purchase Money Mortgage
Purchase Details
Closed on
Dec 22, 2004
Sold by
Anthony Ronald F and Anthony Susan Ann
Bought by
Anthony Susan A
Home Financials for this Owner
Home Financials are based on the most recent Mortgage that was taken out on this home.
Original Mortgage
$149,600
Interest Rate
5.74%
Mortgage Type
Purchase Money Mortgage
Purchase Details
Closed on
May 14, 1991
Sold by
Berard & Sons Inc
Bought by
Anthony Ronald F and Anthony Susan A
Create a Home Valuation Report for This Property
The Home Valuation Report is an in-depth analysis detailing your home's value as well as a comparison with similar homes in the area
Home Values in the Area
Average Home Value in this Area
Purchase History
| Date | Buyer | Sale Price | Title Company |
|---|---|---|---|
| Marchese John P | $170,000 | -- | |
| Anthony Susan A | -- | -- | |
| Anthony Ronald F | $115,900 | -- |
Source: Public Records
Mortgage History
| Date | Status | Borrower | Loan Amount |
|---|---|---|---|
| Open | Anthony Ronald F | $158,850 | |
| Closed | Anthony Ronald F | $169,465 | |
| Closed | Marchese John P | $166,961 | |
| Previous Owner | Anthony Susan A | $149,600 | |
| Previous Owner | Anthony Ronald F | $129,599 |
Source: Public Records
Tax History
| Year | Tax Paid | Tax Assessment Tax Assessment Total Assessment is a certain percentage of the fair market value that is determined by local assessors to be the total taxable value of land and additions on the property. | Land | Improvement |
|---|---|---|---|---|
| 2025 | $3,787 | $241,500 | $64,400 | $177,100 |
| 2024 | $3,761 | $234,200 | $64,400 | $169,800 |
| 2023 | $3,616 | $212,100 | $61,300 | $150,800 |
| 2022 | $3,484 | $185,100 | $64,500 | $120,600 |
| 2021 | $3,328 | $176,100 | $58,600 | $117,500 |
| 2020 | $3,293 | $168,600 | $58,600 | $110,000 |
| 2019 | $3,072 | $156,100 | $58,600 | $97,500 |
| 2018 | $3,125 | $158,800 | $58,600 | $100,200 |
| 2017 | $3,004 | $152,800 | $58,600 | $94,200 |
| 2016 | $2,902 | $147,600 | $58,600 | $89,000 |
| 2015 | $2,903 | $147,600 | $58,600 | $89,000 |
Source: Public Records
Map
Nearby Homes
- 1962 Allen St
- 17 Skyridge Ln
- 55 Allen St
- 0 Apple Blossom Ln
- 25 Laurelwood Ln
- 140 Slumber Ln
- 16 Deerfoot Dr
- 41 Hillside Dr
- 86 Wildwood Ave
- 25 Winding Brook Ln
- 24 Wands St
- 81 W Crystal Brook Dr
- 85 Talmadge Dr
- 46 Holland Dr
- 86 Talmadge Dr
- 228 Acrebrook Rd
- 303 Kibbe Rd
- 25 Angelica Dr
- 137 Mapleshade Ave
- 17 Pebble Mill Rd
- 2035 Parker St
- 2055 Parker St
- 2047 Parker St
- 2025 Parker St
- 2036 Parker St
- 2042 Parker St
- 2026 Parker St
- 2050 Parker St
- 2017 Parker St
- 2058 Parker St
- 2064 Parker St
- 2099 Allen St
- 2016 Parker St
- 2077 Parker St
- 2007 Parker St
- 33 Oak Hollow Rd
- 2078 Parker St
- 2081 Allen St
- 280 Ellendale Cir
- 2012 Parker St
Your Personal Tour Guide
Ask me questions while you tour the home.