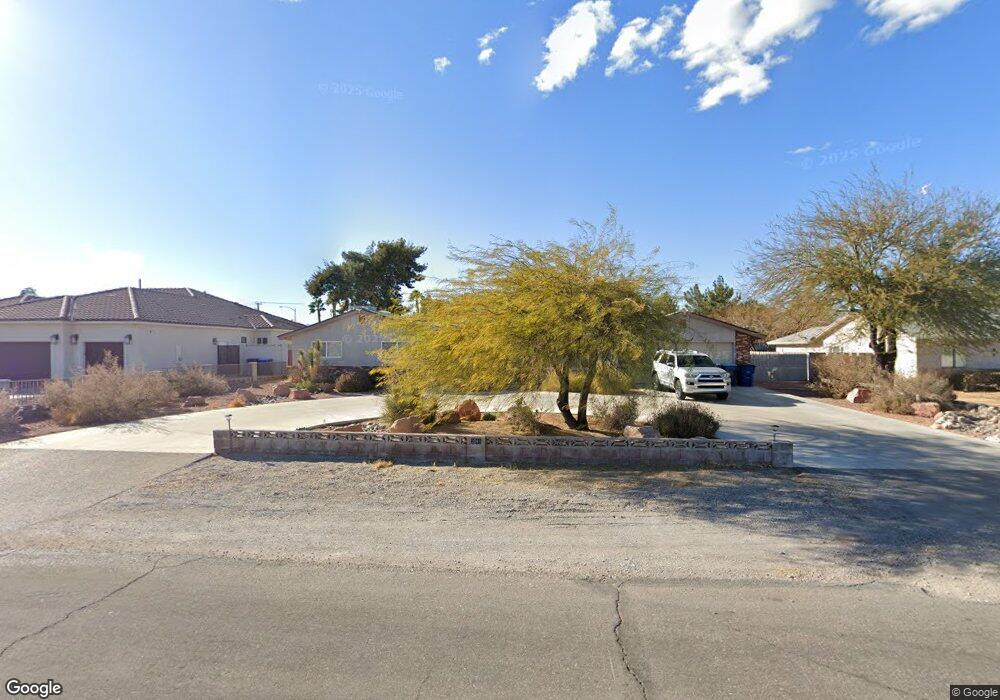
2041 Red Rock St Las Vegas, NV 89146
Canyon Gate NeighborhoodEstimated Value: $570,119 - $753,000
3
Beds
2
Baths
2,094
Sq Ft
$315/Sq Ft
Est. Value
About This Home
This home is located at 2041 Red Rock St, Las Vegas, NV 89146 and is currently estimated at $660,030, approximately $315 per square foot. 2041 Red Rock St is a home located in Clark County with nearby schools including Doris Hancock Elementary School, Hyde Park Middle School, and Bonanza High School.
Ownership History
Date
Name
Owned For
Owner Type
Purchase Details
Closed on
Feb 3, 2014
Sold by
Apodaca Phillip and Arrowood Apodaca Susan
Bought by
Apodaca Phillip and Arrowood Apodaca Susan
Current Estimated Value
Purchase Details
Closed on
Sep 12, 2011
Sold by
Apodaca Phillip L
Bought by
Apodaca Phillip L and Arrowood Apodaca Susan
Purchase Details
Closed on
Jul 1, 2003
Sold by
Apodaca Phillip L
Bought by
Apodaca Phillip L and Arrowood Apodaca Susan K
Home Financials for this Owner
Home Financials are based on the most recent Mortgage that was taken out on this home.
Original Mortgage
$187,500
Interest Rate
5.37%
Mortgage Type
Unknown
Purchase Details
Closed on
Jun 27, 2003
Sold by
Arrowood Apodaca Susan K
Bought by
Apodaca Phillip L
Home Financials for this Owner
Home Financials are based on the most recent Mortgage that was taken out on this home.
Original Mortgage
$187,500
Interest Rate
5.37%
Mortgage Type
Unknown
Purchase Details
Closed on
Nov 20, 1996
Sold by
Countess Jerome D and Countess Rae J
Bought by
Apodaca Phillip L and Arrowood Apodaca Susan K
Home Financials for this Owner
Home Financials are based on the most recent Mortgage that was taken out on this home.
Original Mortgage
$168,550
Interest Rate
7.91%
Create a Home Valuation Report for This Property
The Home Valuation Report is an in-depth analysis detailing your home's value as well as a comparison with similar homes in the area
Home Values in the Area
Average Home Value in this Area
Purchase History
| Date | Buyer | Sale Price | Title Company |
|---|---|---|---|
| Apodaca Phillip | -- | Fidelity National Title | |
| Apodaca Phillip L | -- | None Available | |
| Apodaca Phillip L | -- | -- | |
| Apodaca Phillip L | -- | Lawyers Title Of Nevada | |
| Apodaca Phillip L | $178,000 | Nevada Title Insurance Compa |
Source: Public Records
Mortgage History
| Date | Status | Borrower | Loan Amount |
|---|---|---|---|
| Closed | Apodaca Phillip L | $187,500 | |
| Closed | Apodaca Phillip L | $168,550 |
Source: Public Records
Tax History Compared to Growth
Tax History
| Year | Tax Paid | Tax Assessment Tax Assessment Total Assessment is a certain percentage of the fair market value that is determined by local assessors to be the total taxable value of land and additions on the property. | Land | Improvement |
|---|---|---|---|---|
| 2025 | $2,153 | $110,742 | $66,500 | $44,242 |
| 2024 | $2,091 | $110,742 | $66,500 | $44,242 |
| 2023 | $2,091 | $110,283 | $66,500 | $43,783 |
| 2022 | $2,030 | $102,676 | $61,250 | $41,426 |
| 2021 | $1,971 | $87,588 | $47,250 | $40,338 |
| 2020 | $1,911 | $85,762 | $44,800 | $40,962 |
| 2019 | $1,855 | $79,979 | $38,850 | $41,129 |
| 2018 | $1,801 | $73,754 | $33,250 | $40,504 |
| 2017 | $2,049 | $75,139 | $33,250 | $41,889 |
| 2016 | $1,706 | $64,185 | $21,000 | $43,185 |
| 2015 | $1,702 | $60,455 | $17,500 | $42,955 |
| 2014 | $1,649 | $60,508 | $17,500 | $43,008 |
Source: Public Records
Map
Nearby Homes
- 5991 Obannon Dr
- 1945 Duneville St
- 1700 Red Rock St
- 2175 Westwind Rd
- 6151 Peppermill Dr
- 1970 Westwind Rd
- 5600 El Parque Ave
- 1695 Westwind Rd
- 1705 Westwind Rd
- 2065 Lindell Rd
- 6229 W Oakey Blvd
- 1780 Westwind Rd
- 2216 Verdinal Dr
- 6312 Bluejay Way
- 6320 Vicuna Dr
- 6316 Peppermill Dr
- 6320 Peppermill Dr
- 1920 Springview Dr
- 2221 Mohawk St
- 1440 Covelo Ct
- 2031 Red Rock St
- 2051 Red Rock St
- 2021 Red Rock St
- 2070 Red Rock St
- 2181 Red Rock St
- 2011 Red Rock St
- 2040 Red Rock St
- 2135 Saratoga St
- 5925 Obannon Dr
- 6011 El Parque Ave
- 2215 Red Rock St
- 2001 Red Rock St
- 2030 Red Rock St
- 2010 Red Rock St
- 2210 Red Rock St
- 2104 Saratoga St
- 5585 W El Parque Ave
- 2020 Red Rock St
- 2190 S Jones Blvd
- 5850 Obannon Dr