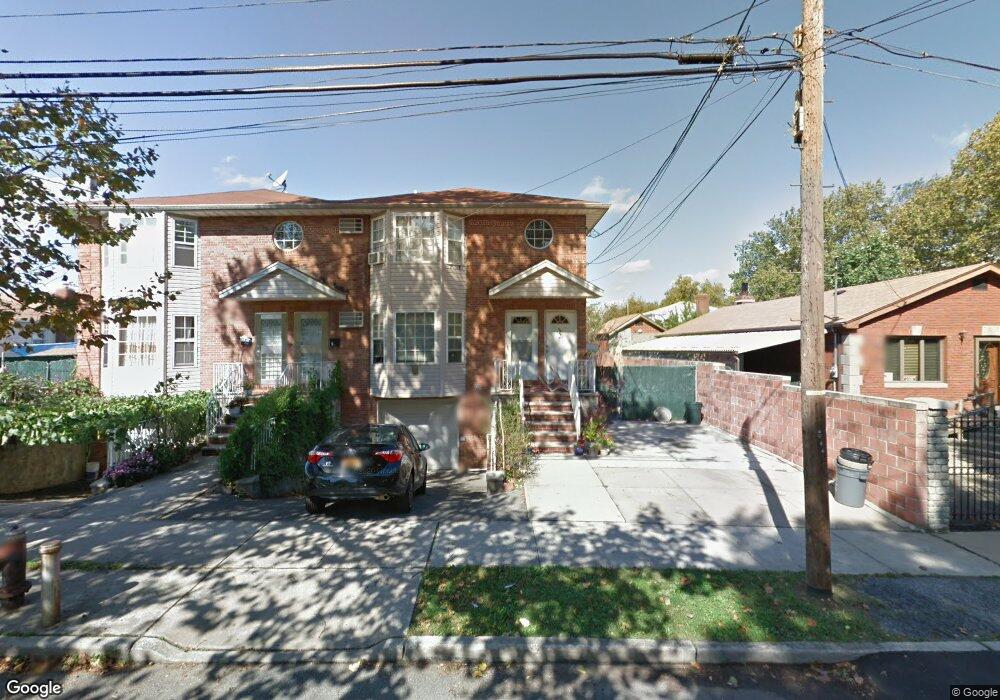
20415 46th Rd Bayside, NY 11361
Auburndale NeighborhoodEstimated Value: $1,235,676 - $1,968,000
--
Bed
--
Bath
2,300
Sq Ft
$731/Sq Ft
Est. Value
About This Home
This home is located at 20415 46th Rd, Bayside, NY 11361 and is currently estimated at $1,680,419, approximately $730 per square foot. 20415 46th Rd is a home located in Queens County with nearby schools including P.S. 162 The John Golden School, M.S. 158 - Marie Curie, and Francis Lewis High School.
Ownership History
Date
Name
Owned For
Owner Type
Purchase Details
Closed on
Jul 18, 2023
Sold by
Chaimov Rubin
Bought by
R & C Reality Llc
Current Estimated Value
Home Financials for this Owner
Home Financials are based on the most recent Mortgage that was taken out on this home.
Original Mortgage
$688,000
Outstanding Balance
$670,588
Interest Rate
6.69%
Mortgage Type
Purchase Money Mortgage
Estimated Equity
$1,009,831
Purchase Details
Closed on
Dec 22, 2014
Sold by
Chaimov Rubin and Haimov Ruven
Bought by
Chaimov Rubin
Purchase Details
Closed on
Aug 24, 2004
Sold by
Haimov Tamara
Bought by
Haimov Ruven and Haimov Tamara
Purchase Details
Closed on
Feb 3, 2000
Sold by
Arzanipour Nancy and Arzanipour Paul
Bought by
Haimov Tamara
Home Financials for this Owner
Home Financials are based on the most recent Mortgage that was taken out on this home.
Original Mortgage
$376,000
Interest Rate
8.25%
Mortgage Type
Purchase Money Mortgage
Create a Home Valuation Report for This Property
The Home Valuation Report is an in-depth analysis detailing your home's value as well as a comparison with similar homes in the area
Home Values in the Area
Average Home Value in this Area
Purchase History
| Date | Buyer | Sale Price | Title Company |
|---|---|---|---|
| R & C Reality Llc | -- | -- | |
| R & C Reality Llc | -- | -- | |
| Chaimov Rubin | -- | -- | |
| Chaimov Rubin | -- | -- | |
| Haimov Ruven | -- | -- | |
| Haimov Ruven | -- | -- | |
| Haimov Tamara | $483,000 | -- | |
| Haimov Tamara | $483,000 | -- |
Source: Public Records
Mortgage History
| Date | Status | Borrower | Loan Amount |
|---|---|---|---|
| Open | R & C Reality Llc | $688,000 | |
| Closed | R & C Reality Llc | $688,000 | |
| Previous Owner | Haimov Tamara | $376,000 |
Source: Public Records
Tax History Compared to Growth
Tax History
| Year | Tax Paid | Tax Assessment Tax Assessment Total Assessment is a certain percentage of the fair market value that is determined by local assessors to be the total taxable value of land and additions on the property. | Land | Improvement |
|---|---|---|---|---|
| 2025 | $12,474 | $65,832 | $9,707 | $56,125 |
| 2024 | $12,474 | $62,107 | $10,782 | $51,325 |
| 2023 | $12,462 | $62,046 | $9,344 | $52,702 |
| 2022 | $12,305 | $85,620 | $13,500 | $72,120 |
| 2021 | $12,238 | $70,980 | $13,500 | $57,480 |
| 2020 | $11,612 | $78,000 | $13,500 | $64,500 |
| 2019 | $10,827 | $77,760 | $13,500 | $64,260 |
| 2018 | $10,540 | $51,705 | $9,520 | $42,185 |
| 2017 | $10,471 | $51,366 | $11,156 | $40,210 |
| 2016 | $9,687 | $51,366 | $11,156 | $40,210 |
| 2015 | $5,844 | $45,717 | $12,756 | $32,961 |
| 2014 | $5,844 | $43,130 | $11,471 | $31,659 |
Source: Public Records
Map
Nearby Homes
- 204-19 46th Rd
- 4607 204th St
- 46-38 204th St
- 46-27 206th St
- 20222 45th Dr
- 202-30 45th Rd
- 202-04 45th Dr
- 206-50 46th Ave
- 206-16 45th Rd
- 206-18 45th Rd
- 4732 207th St
- 206-38 45th Rd
- 208-2 47th Ave
- 208-4 47th Ave
- 43-19 205th St
- 48-18 202nd St
- 48-35 Clearview Expy
- 43-24 208th St
- 199-04 47th Ave
- 48-46 206th St Unit 2
- 204-15-204-46 46th Rd
- 204-15 46th Rd
- 20419 46th Rd
- 20411 46th Rd
- 204-23 46th Rd
- 204-18 46th Ave
- 20420 46th Ave Unit 1
- 20420 46th Ave Unit 2
- 20416 46th Rd
- 4621 204th St
- 4617 204th St
- 20426 46th Ave
- 46-07 204th St
- 4609 204th St
- 20418 46th Ave
- 20428 46th Ave
- 4631 204th St
- 46-09 204th St
- 46-09 204th St Unit 2
- 46-35 204th St