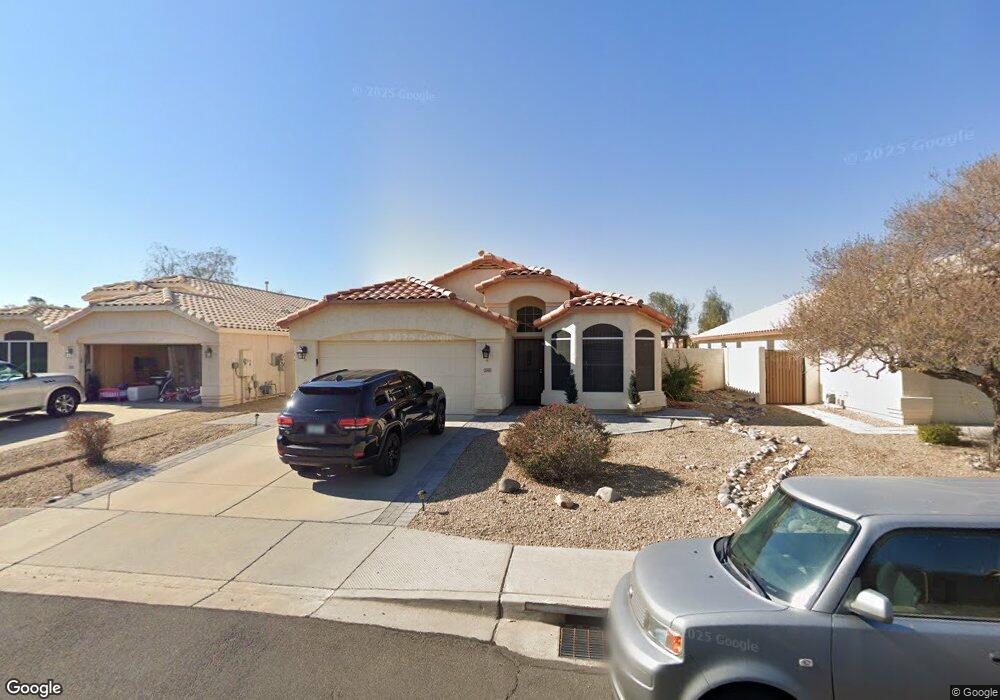
20418 N 96th Ln Peoria, AZ 85382
Estimated Value: $416,397 - $472,000
3
Beds
3
Baths
1,667
Sq Ft
$271/Sq Ft
Est. Value
About This Home
This home is located at 20418 N 96th Ln, Peoria, AZ 85382 and is currently estimated at $451,599, approximately $270 per square foot. 20418 N 96th Ln is a home located in Maricopa County with nearby schools including Parkridge Elementary School and Sunrise Mountain High School.
Ownership History
Date
Name
Owned For
Owner Type
Purchase Details
Closed on
Nov 18, 2016
Sold by
Lancea Stephen J and Lancea Jacqueline
Bought by
Goltz Jeremy E and Goltz Brandi M Harp
Current Estimated Value
Home Financials for this Owner
Home Financials are based on the most recent Mortgage that was taken out on this home.
Original Mortgage
$223,100
Outstanding Balance
$179,953
Interest Rate
3.57%
Mortgage Type
New Conventional
Estimated Equity
$271,646
Purchase Details
Closed on
Jul 11, 2002
Sold by
Gorman James R and Gorman Karen M
Bought by
Lancea Stephen J and Lancea Jacqueline
Home Financials for this Owner
Home Financials are based on the most recent Mortgage that was taken out on this home.
Original Mortgage
$130,400
Interest Rate
6.51%
Purchase Details
Closed on
Mar 25, 1999
Sold by
Chi Construction Company
Bought by
Continental Homes Inc
Purchase Details
Closed on
Mar 16, 1999
Sold by
Continental Homes Inc
Bought by
Gorman James R and Gorman Karen M
Create a Home Valuation Report for This Property
The Home Valuation Report is an in-depth analysis detailing your home's value as well as a comparison with similar homes in the area
Home Values in the Area
Average Home Value in this Area
Purchase History
| Date | Buyer | Sale Price | Title Company |
|---|---|---|---|
| Goltz Jeremy E | $230,000 | First American Title Ins Co | |
| Lancea Stephen J | $163,000 | American Title Ins Agency | |
| Continental Homes Inc | -- | First American Title | |
| Gorman James R | $122,843 | First American Title |
Source: Public Records
Mortgage History
| Date | Status | Borrower | Loan Amount |
|---|---|---|---|
| Open | Goltz Jeremy E | $223,100 | |
| Previous Owner | Lancea Stephen J | $130,400 |
Source: Public Records
Tax History Compared to Growth
Tax History
| Year | Tax Paid | Tax Assessment Tax Assessment Total Assessment is a certain percentage of the fair market value that is determined by local assessors to be the total taxable value of land and additions on the property. | Land | Improvement |
|---|---|---|---|---|
| 2025 | $1,564 | $21,598 | -- | -- |
| 2024 | $1,657 | $20,570 | -- | -- |
| 2023 | $1,657 | $33,630 | $6,720 | $26,910 |
| 2022 | $1,623 | $25,660 | $5,130 | $20,530 |
| 2021 | $1,737 | $23,530 | $4,700 | $18,830 |
| 2020 | $1,753 | $22,320 | $4,460 | $17,860 |
| 2019 | $1,697 | $20,550 | $4,110 | $16,440 |
| 2018 | $1,641 | $19,510 | $3,900 | $15,610 |
| 2017 | $1,642 | $17,880 | $3,570 | $14,310 |
| 2016 | $1,898 | $17,200 | $3,440 | $13,760 |
| 2015 | $1,766 | $16,730 | $3,340 | $13,390 |
Source: Public Records
Map
Nearby Homes
- 20424 N 96th Ln
- 9627 W Menadota Dr
- 9529 W Runion Dr
- 9510 W Menadota Dr
- 9551 W Sierra Pinta Dr
- 9818 W Pontiac Dr
- 9651 W Potter Dr
- 9729 W Burnett Rd
- 20961 N 96th Dr
- 20967 N 96th Ln
- 9403 W Escuda Dr
- 20508 N 93rd Ln
- 9455 W Behrend Dr
- 9321 W Clara Ln
- 9717 W Marco Polo Rd
- 9869 W Chino Dr
- 9331 W Runion Dr
- 20149 N 92nd Ave
- 9832 W Behrend Dr
- 9704 W Tonto Ln
- 20412 N 96th Ln
- 20430 N 96th Ln
- 9632 W Tonopah Dr
- 20436 N 96th Ln
- 9637 W Clara Ln
- 9626 W Tonopah Dr
- 20440 N 96th Ln
- 9625 W Tonopah Dr
- 9631 W Clara Ln
- 9620 W Tonopah Dr
- 9619 W Tonopah Dr
- 20446 N 96th Ln
- 9625 W Clara Ln
- 9718 W Pontiac Dr
- 9613 W Tonopah Dr
- 9614 W Tonopah Dr
- 9644 W Clara Ln
- 9619 W Clara Ln
- 20452 N 96th Ln
- 9638 W Clara Ln